- Spotting non-linear clusters that PCA misses
- Quick visual check for natural groupings
- Communicating data structure to non-technical stakeholders
Configuring a t-SNE run
In the Configure run card on the analysis detail page, select t-SNE.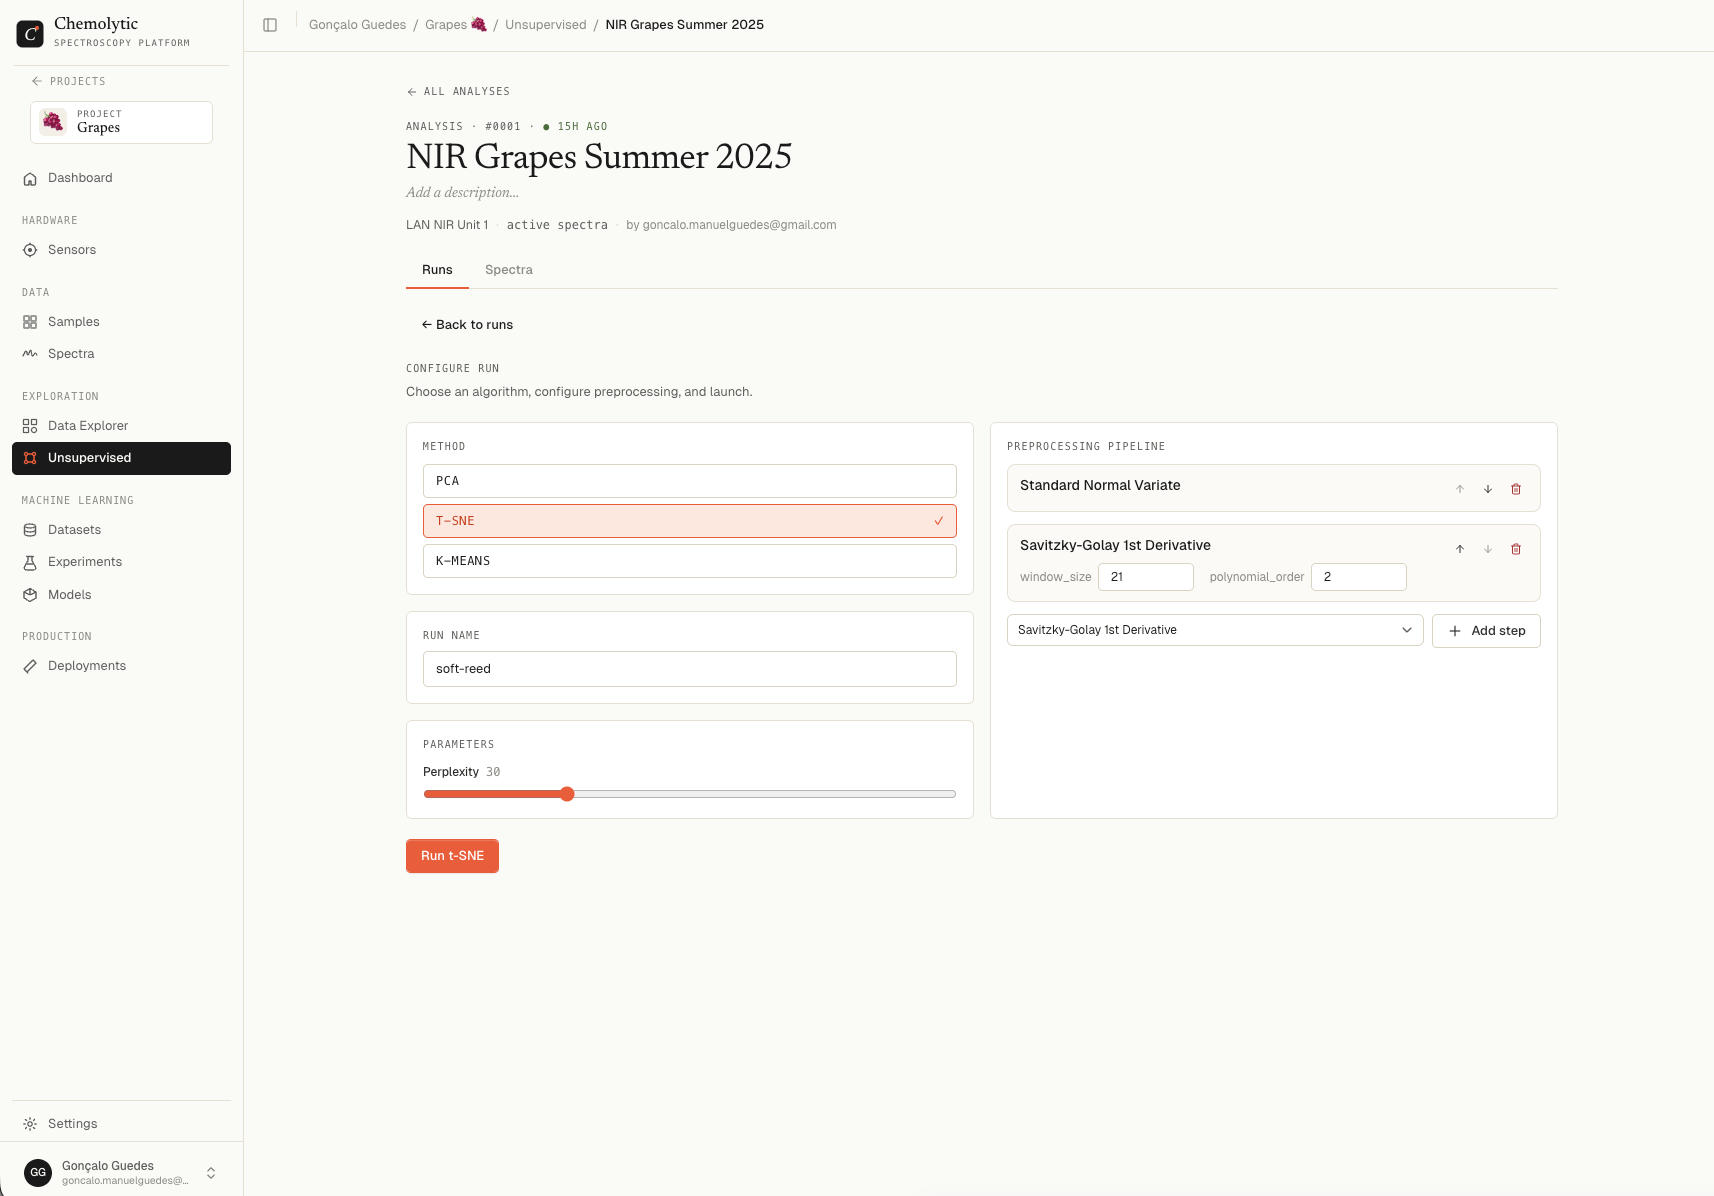
Parameters
Choosing perplexity
Click Launch run. Status goes through “Queueing”, “Analysing”, “Done”.
Reading the results
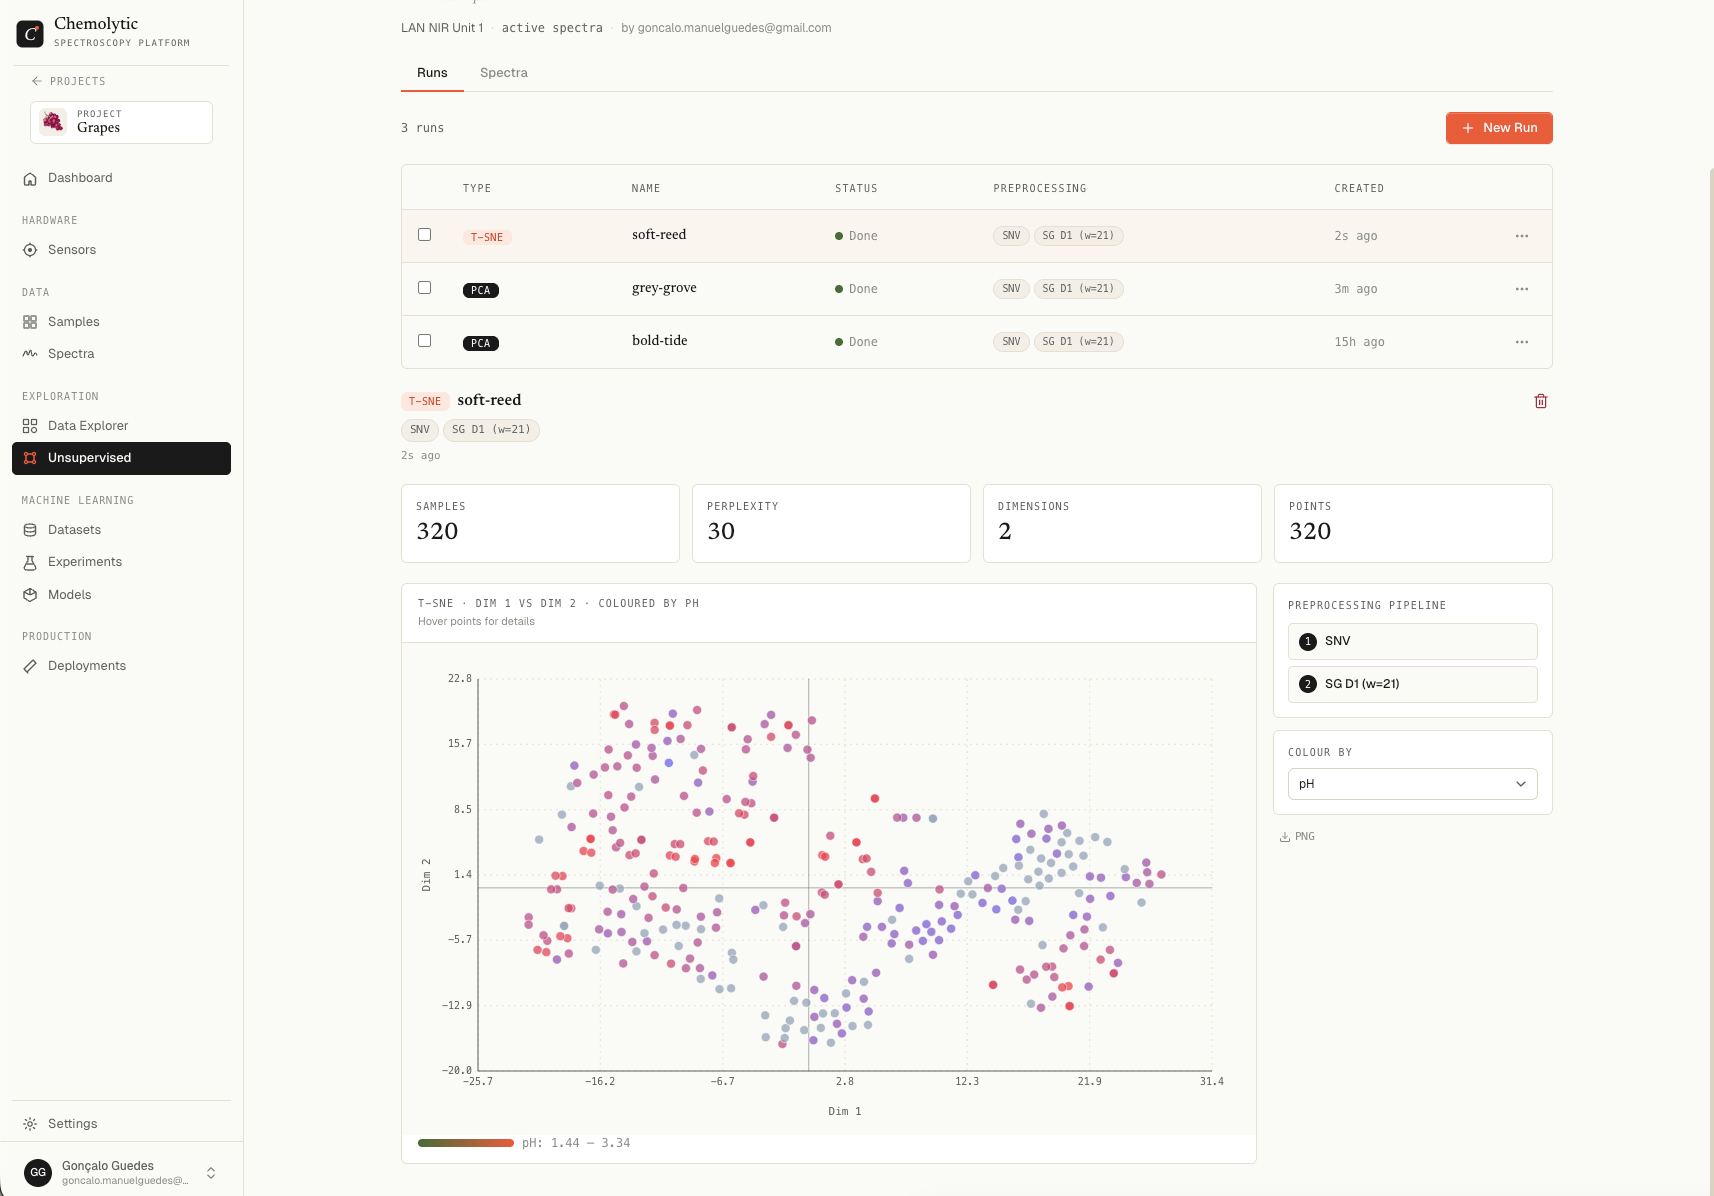
Embedding plot
A 2D scatter plot. Dim 1 is the horizontal axis, Dim 2 is the vertical axis. Each point is one spectrum. The axes themselves have no inherent meaning in t-SNE. Only relative distances between points matter:- Points close together = similar spectra
- Points far apart = dissimilar spectra
- Point clusters = natural groupings
Colour by
Pick a property to colour the points. If samples coloured by a property segregate into distinct regions of the map, that property has a strong signal in your spectra.Common patterns
Limitations
- Stochastic: every run produces a different layout, even with the same parameters
- No global meaning: distances between far-apart clusters are not meaningful
- Slow on large datasets: 10,000+ samples take noticeably longer
- Sensitive to parameters: small perplexity changes can produce very different maps