Once you have several runs in the same analysis, you’ll want to compare them to decide which preprocessing or method to use going forward.
Selecting runs to compare
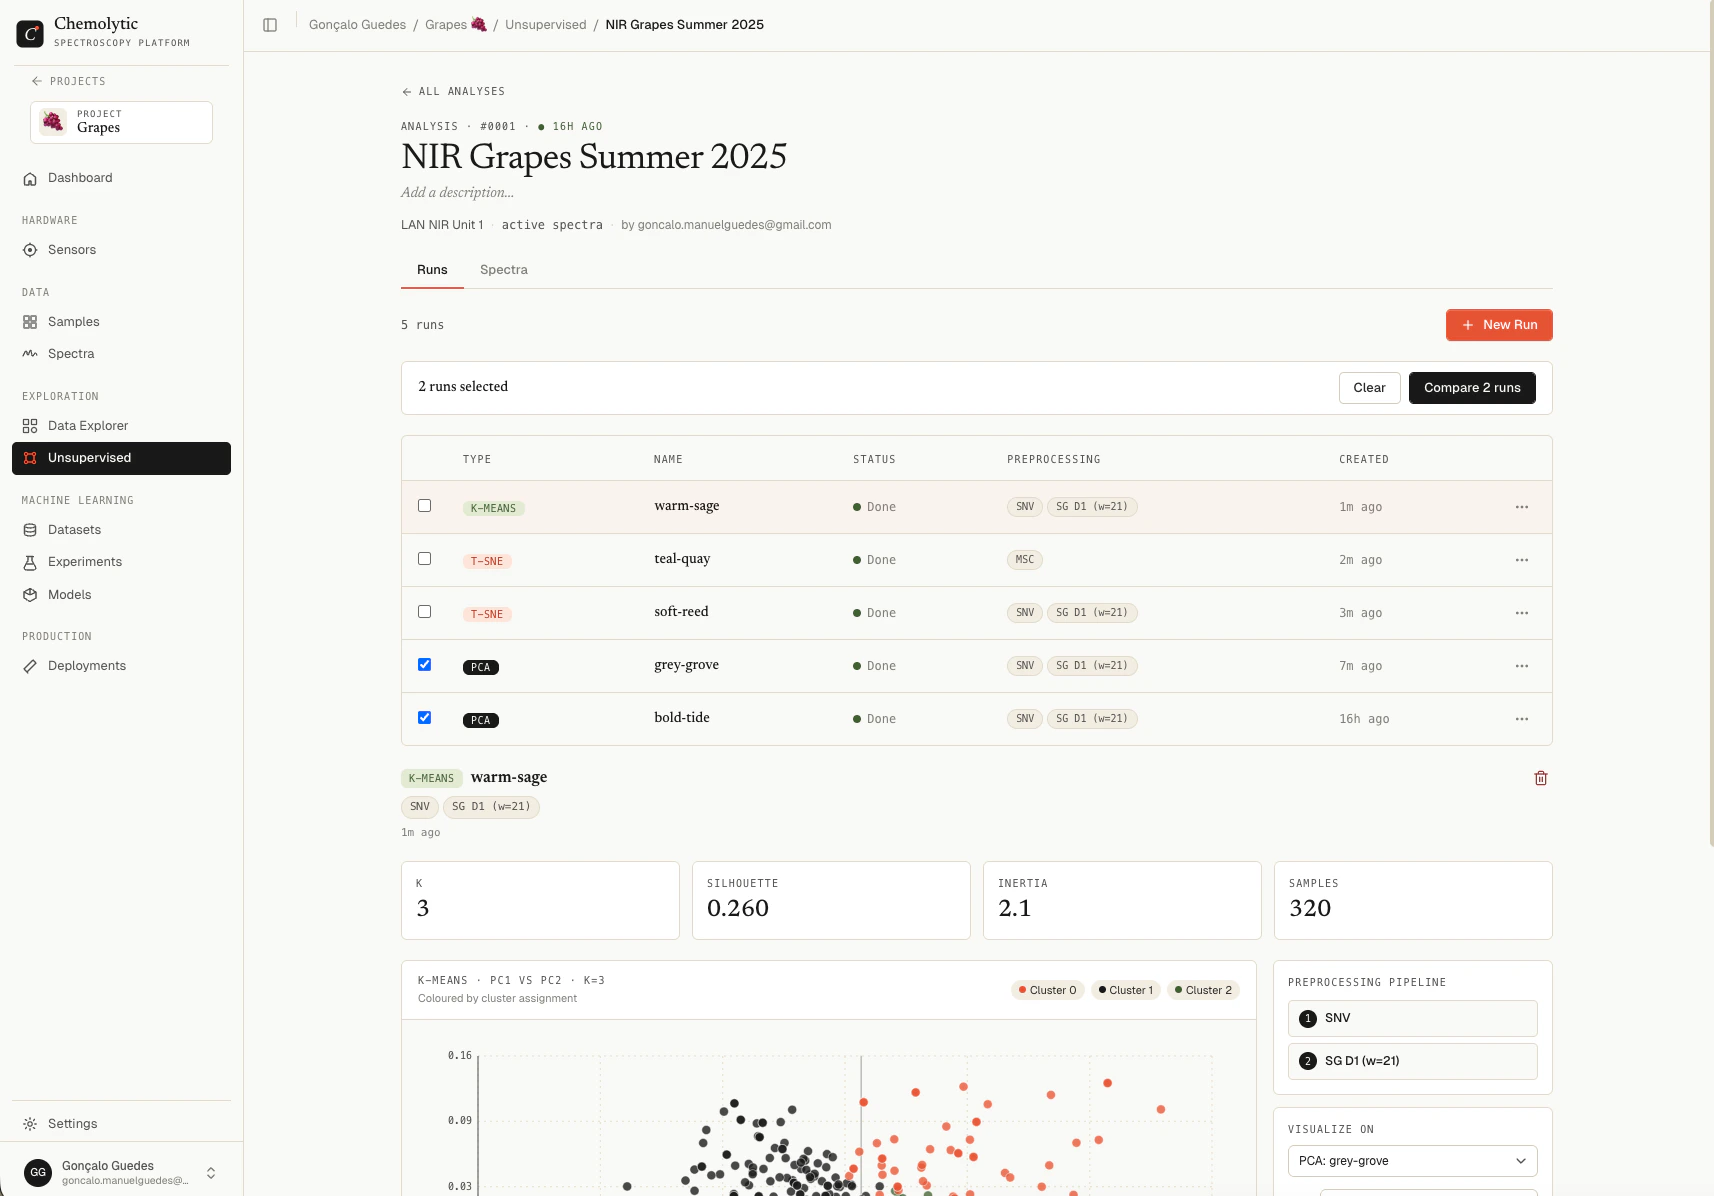
On the analysis detail page, select multiple runs using the checkboxes in the runs list, then click Compare.
The compare page opens with all selected runs.
View modes
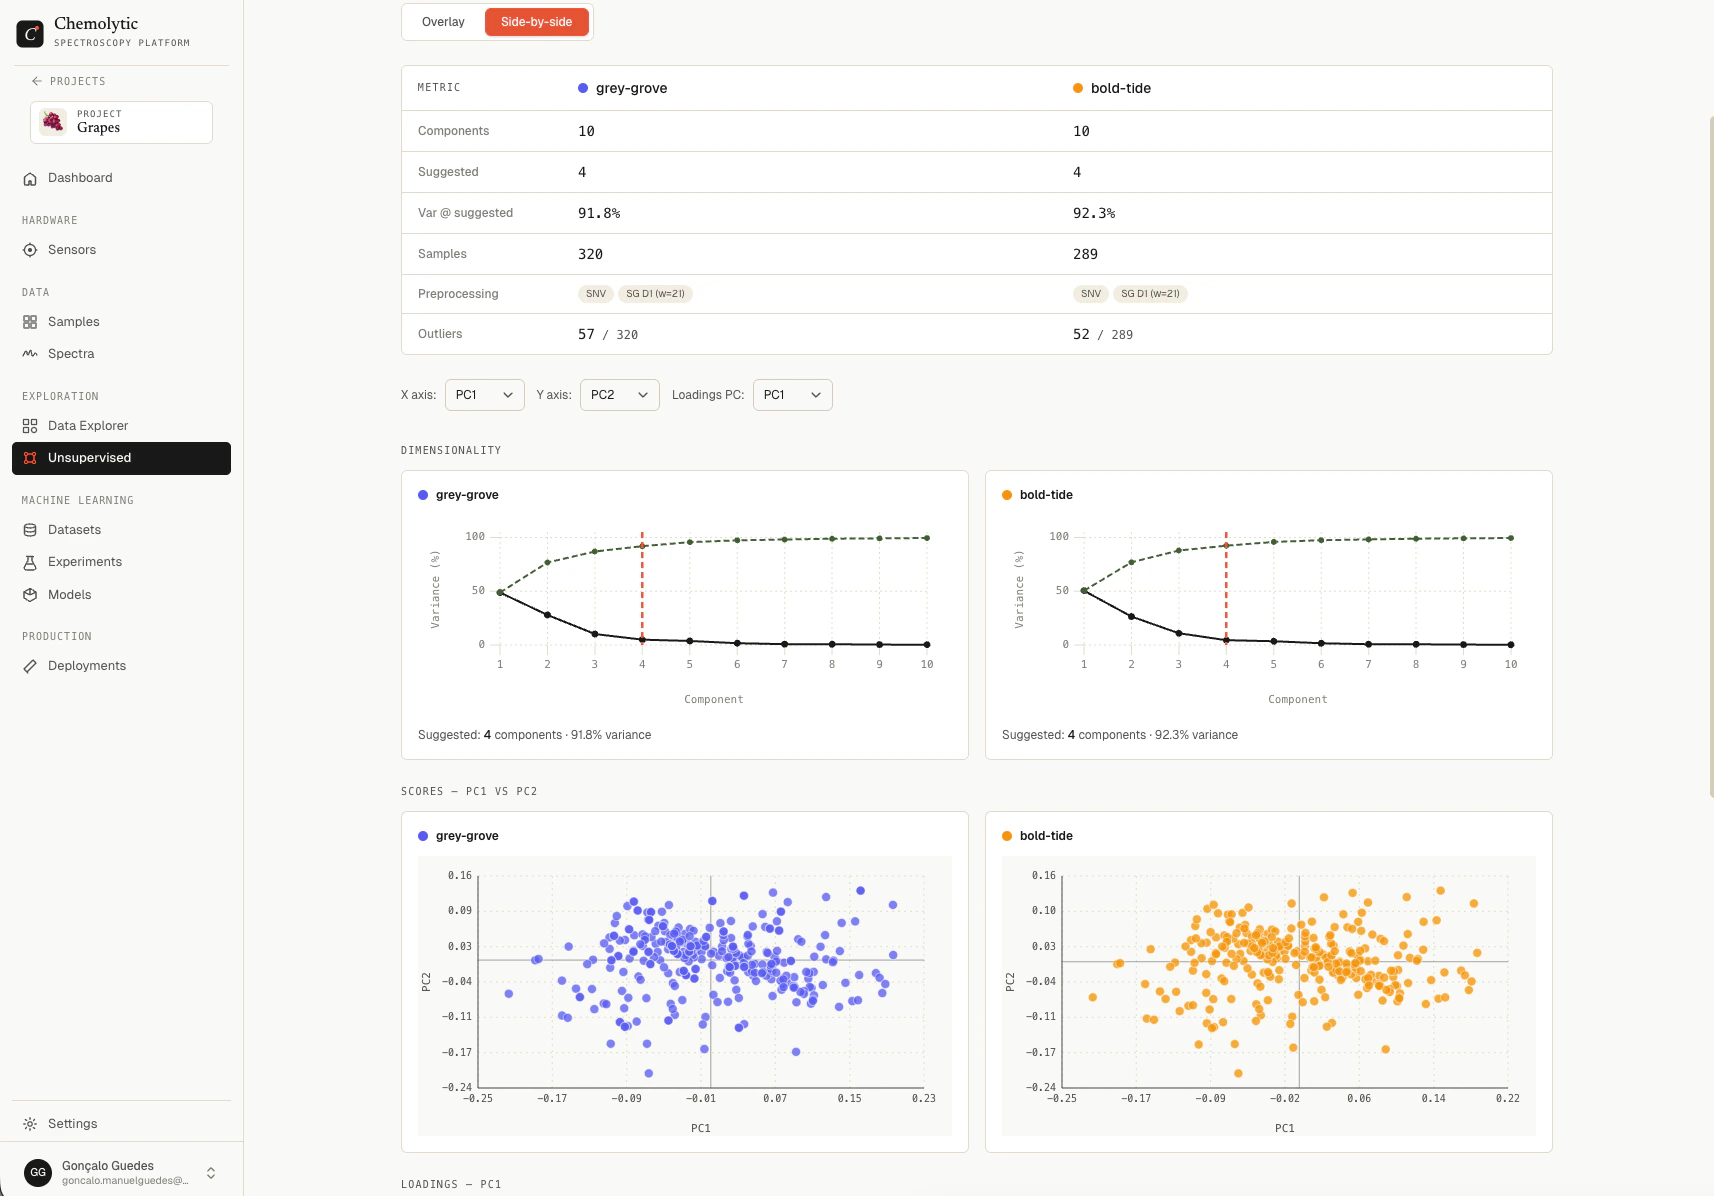
Two display modes available at the top:
Comparing PCA runs
The compare page shows:
- Metrics table: components, suggested count, variance at suggested, sample count, preprocessing, outliers
- Scree plot: explained variance per component, one line per run
- Scores plot: PC1 vs PC2 (configurable axes), all points coloured by run
- Loadings plot: spectral loadings for the selected PC, one line per run
- Outliers plot: T² vs Q residuals, all points overlaid
In side-by-side mode, the same plots appear once per run, with shared axes controls at the top so you can change the PC selection across all panels at once.
The fastest way to choose preprocessing: compare the scree plots of multiple runs. The pipeline that captures the most variance in the first few components is usually the best choice.
Comparing t-SNE runs
t-SNE compare shows each run’s 2D embedding.
In overlay mode, all points appear on the same plot, coloured by run. This is rarely useful because t-SNE coordinates are not comparable between runs (different random initializations).
In side-by-side mode, each run gets its own panel. This is the right way to compare t-SNE runs: look at the cluster structure of each map, ignore the absolute positions.
The compare page shows the warning: “t-SNE spaces are independent per run. Embeddings are not directly comparable.” This means cluster shapes matter, not coordinates.
Comparing K-Means runs
K-Means compare shows:
- Metrics table: k, silhouette, inertia, sample count for each run
- Cluster sizes: bar chart per run showing how samples split
Use this to find the value of k with the highest silhouette and balanced cluster sizes.
Tips for effective comparison
Compare runs that differ in only one thing. If you change preprocessing AND method between runs, you can’t tell which change caused the difference. Make one change at a time.
Keep at most 4 runs in a comparison. More than that becomes hard to read in overlay mode.
Promote a winning run. Once you find the best preprocessing pipeline, use it as the starting point for your supervised experiments.