- Discovering unknown classes in your data (e.g., variety, origin, defect type)
- Validating that an expected categorization is actually visible in spectra
- Generating cluster labels that you can promote to a categorical property
Configuring a K-Means run
In the Configure run card on the analysis detail page, select K-Means.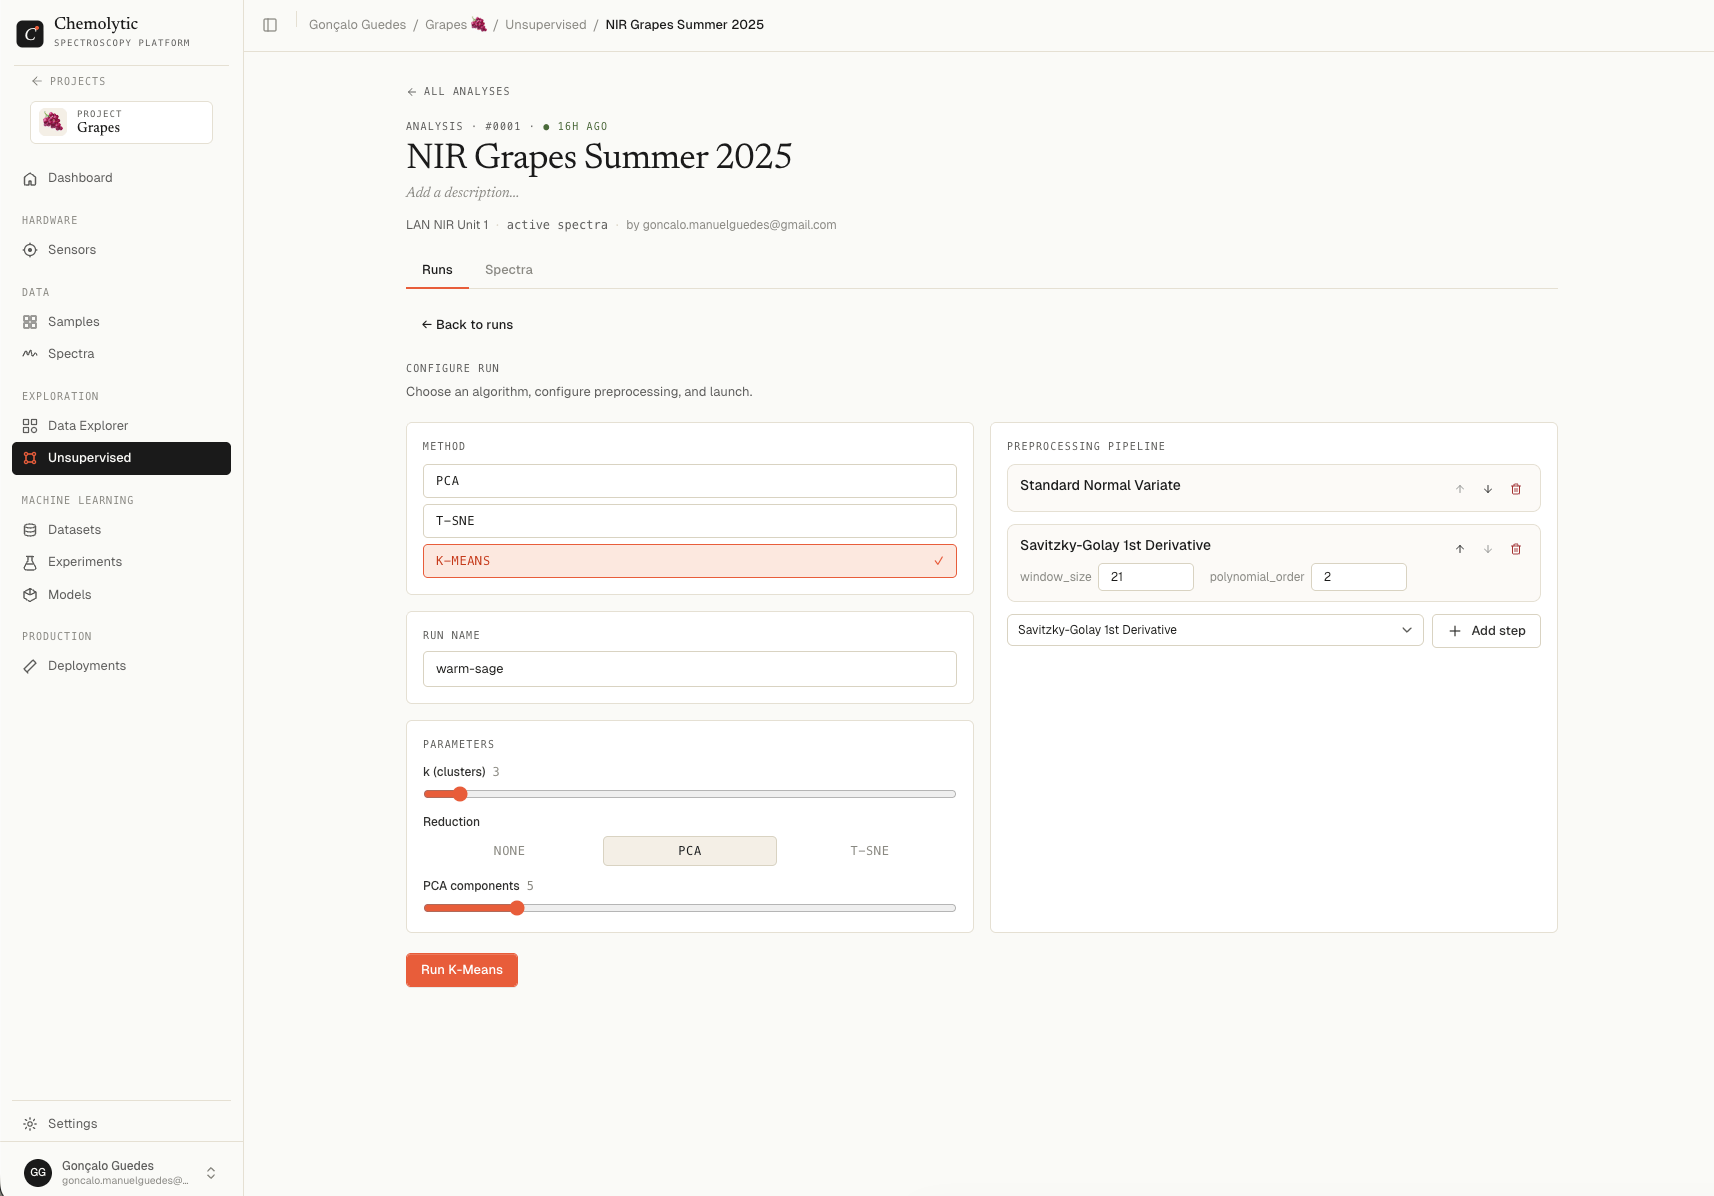
Parameters
Choosing k
Reduction
By default, K-Means runs on the full preprocessed spectra. You can optionally reduce dimensions first:
When you select PCA, an additional PCA components slider appears (default 5).
When you select t-SNE, a Perplexity slider appears (default 30).
Click Launch run.
Reading the results
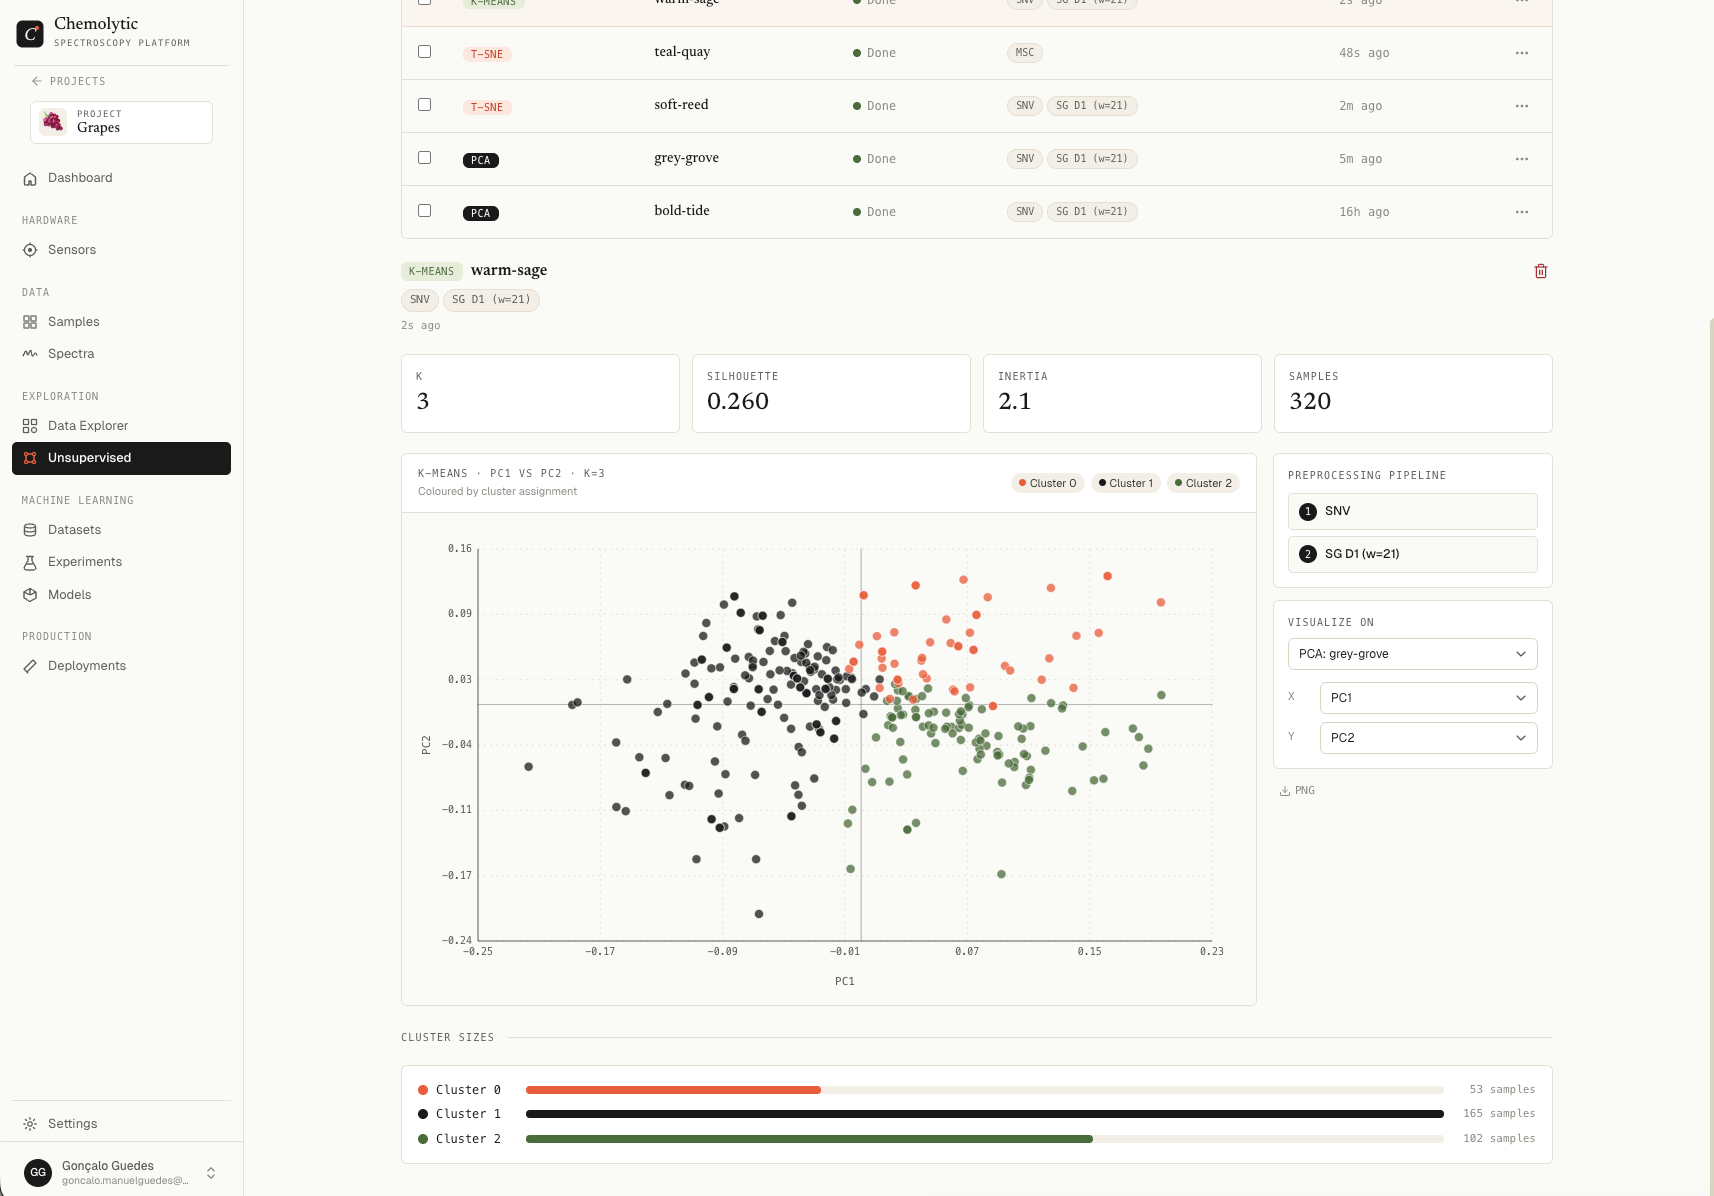
Metrics table
Silhouette interpretation
Cluster sizes
Horizontal bar chart showing how many samples fell into each cluster. Each cluster gets a colour from the palette.What to do with cluster labels
Once K-Means finds clusters that match what you expected (e.g., the silhouette is high and the cluster sizes are reasonable), you can:- Validate: open each cluster and look at the original samples. Are they meaningfully similar?
- Promote: create a new categorical property called something like “K-Means group” with categories matching the cluster IDs, then assign each sample to its cluster
- Train a classifier: use the new property as the target in an Experiment to train a model that predicts cluster membership from spectra
Limitations
- K must be set in advance: K-Means doesn’t find the “right” number of clusters on its own
- Spherical assumption: K-Means assumes clusters are roughly round. Long, curved structures get cut into pieces
- Sensitive to scale: preprocessing matters a lot. SNV or autoscale before K-Means
- Random initialization: results can vary slightly between runs even with the same k