Sensor filter
By default, all sensors are included. Use the Sensor dropdown at the top to focus on a specific instrument. Click Clear to go back to all sensors. This filter affects every metric on the page: counts, modelling readiness, and property statistics are all computed only on samples linked to the selected sensor.Overview tab
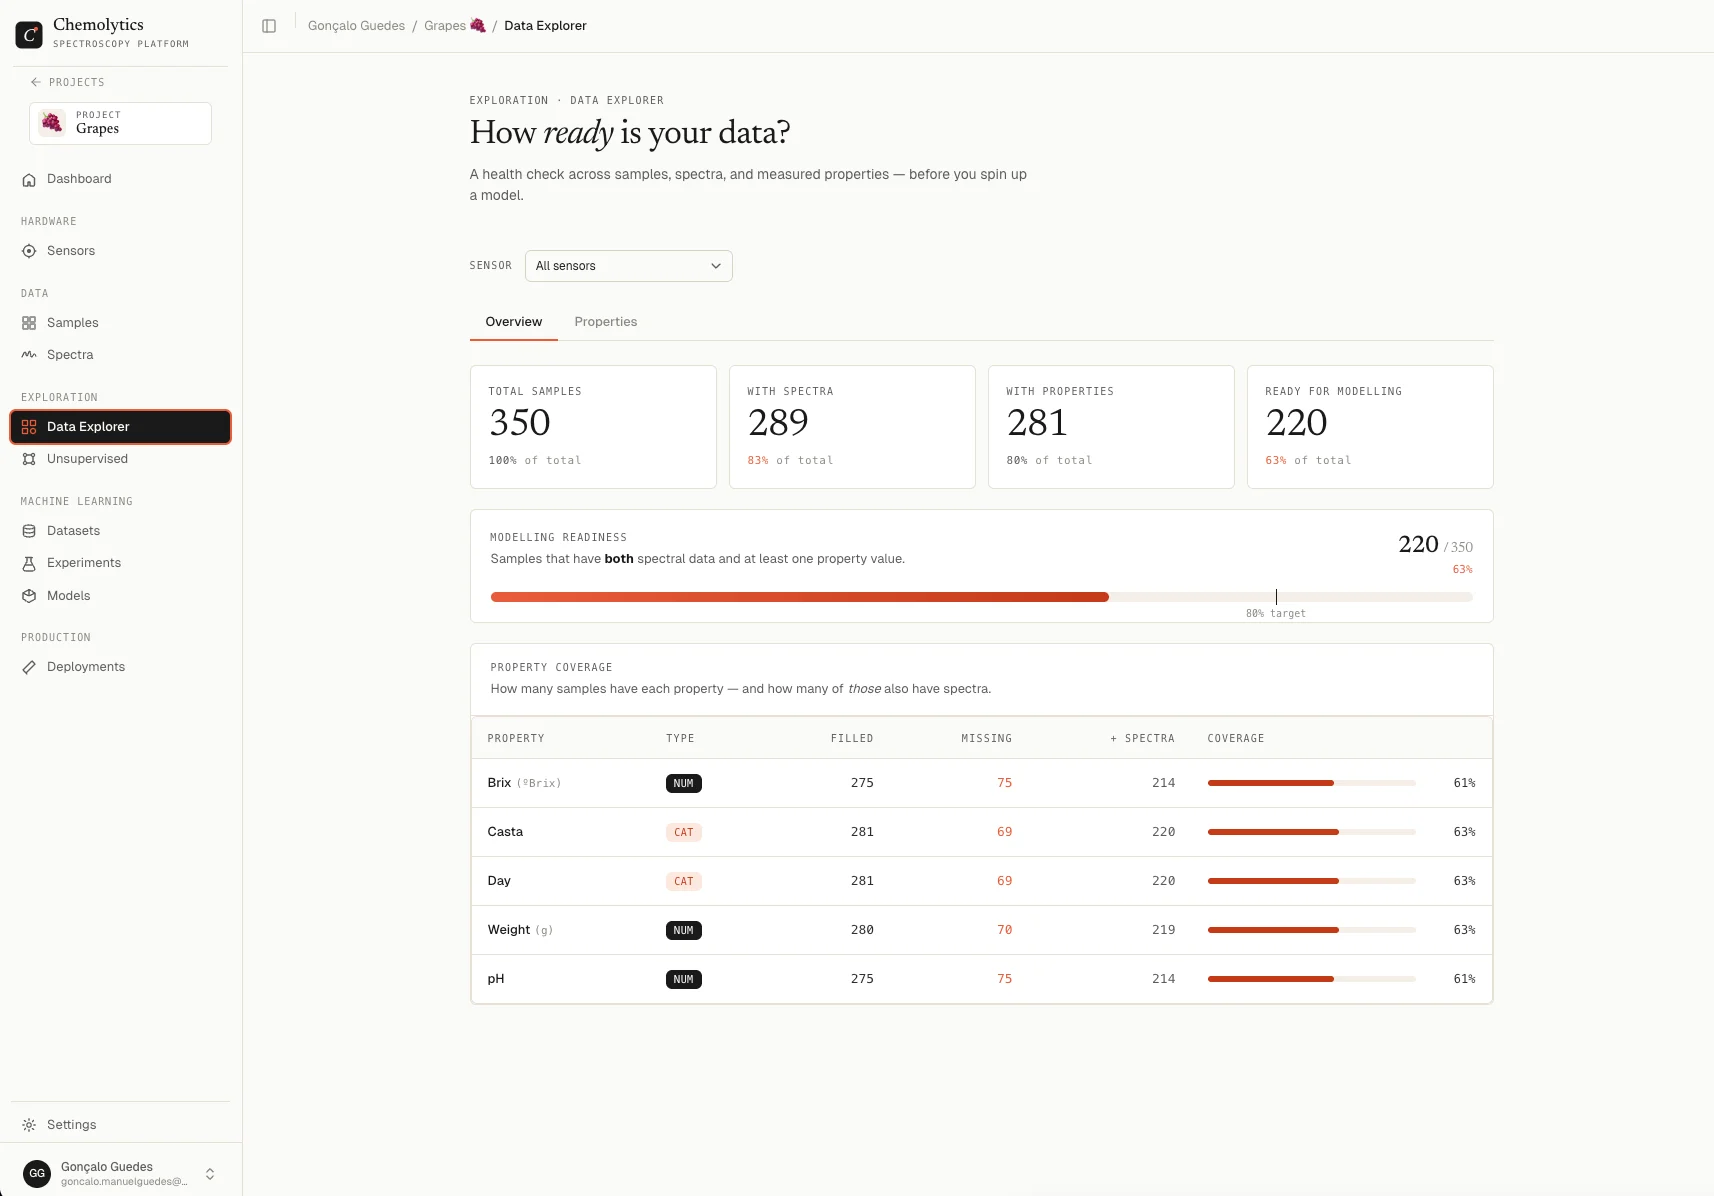
Stat tiles
Four numbers across the top:
The “Ready for modelling” number is the only one that matters for training. Samples missing spectra or property values cannot contribute to a model.
Modelling readiness bar
Shows the same “Ready for modelling” number as a progress bar, with a vertical tick at 80%.Property coverage
The table below shows, for each property:
Coverage colors:
- Green (95% or higher): excellent coverage
- Orange (70-94%): acceptable, but watch for bias
- Red (below 70%): risky to model from
Properties tab
The Properties tab shows distribution statistics for every property.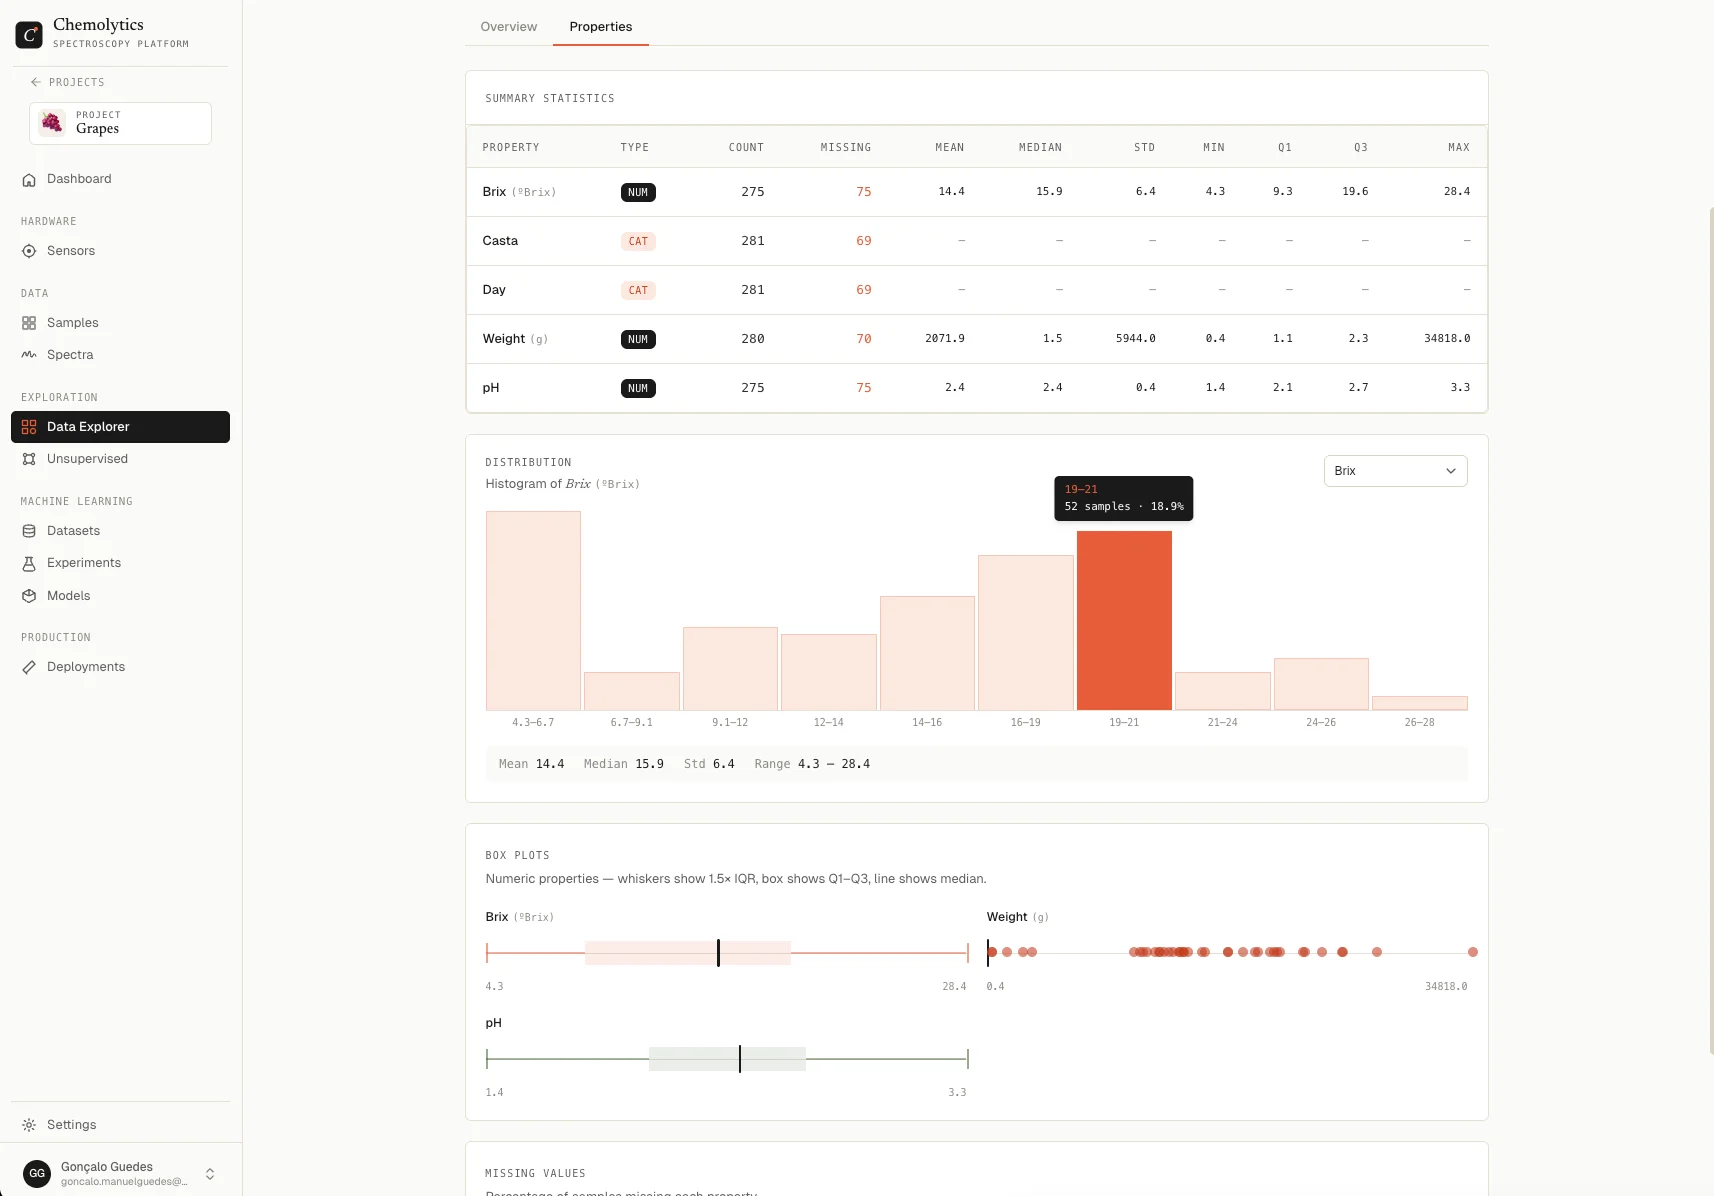
Continuous properties
Each continuous property shows:
A histogram plots the distribution across 10 bins. Use it to spot:
- Skewed distributions (most values clustered on one end)
- Bimodal patterns (two peaks suggesting two underlying groups)
- Gaps where data is missing in a range
Categorical properties
Each categorical property shows a donut chart of category counts with the total in the centre and a per-category breakdown (count and percentage) on the side.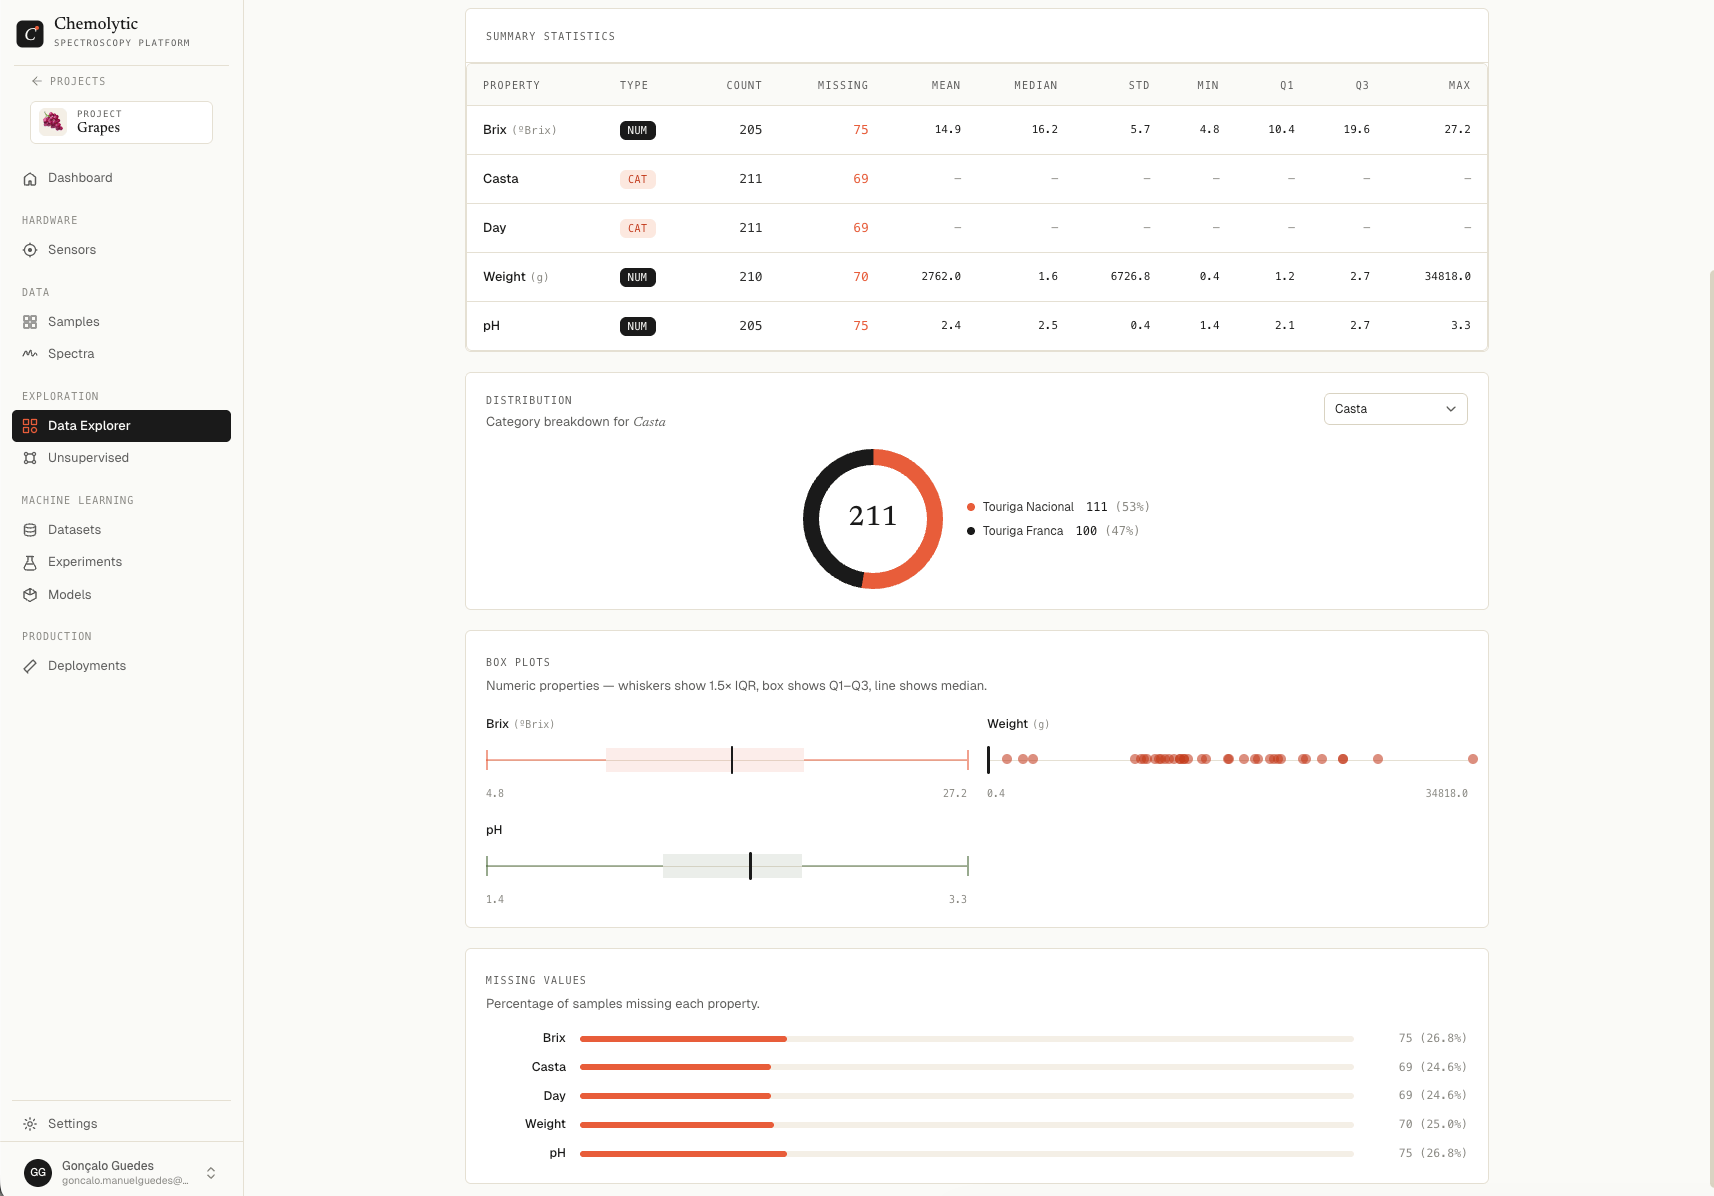
When to come back
Visit the Data Explorer:- After uploading spectra: confirm the readiness number went up
- After importing samples via CSV: check property coverage didn’t introduce gaps
- Before running an experiment: spot any imbalance or outliers that could bias the model
- After deleting samples: confirm coverage is still acceptable