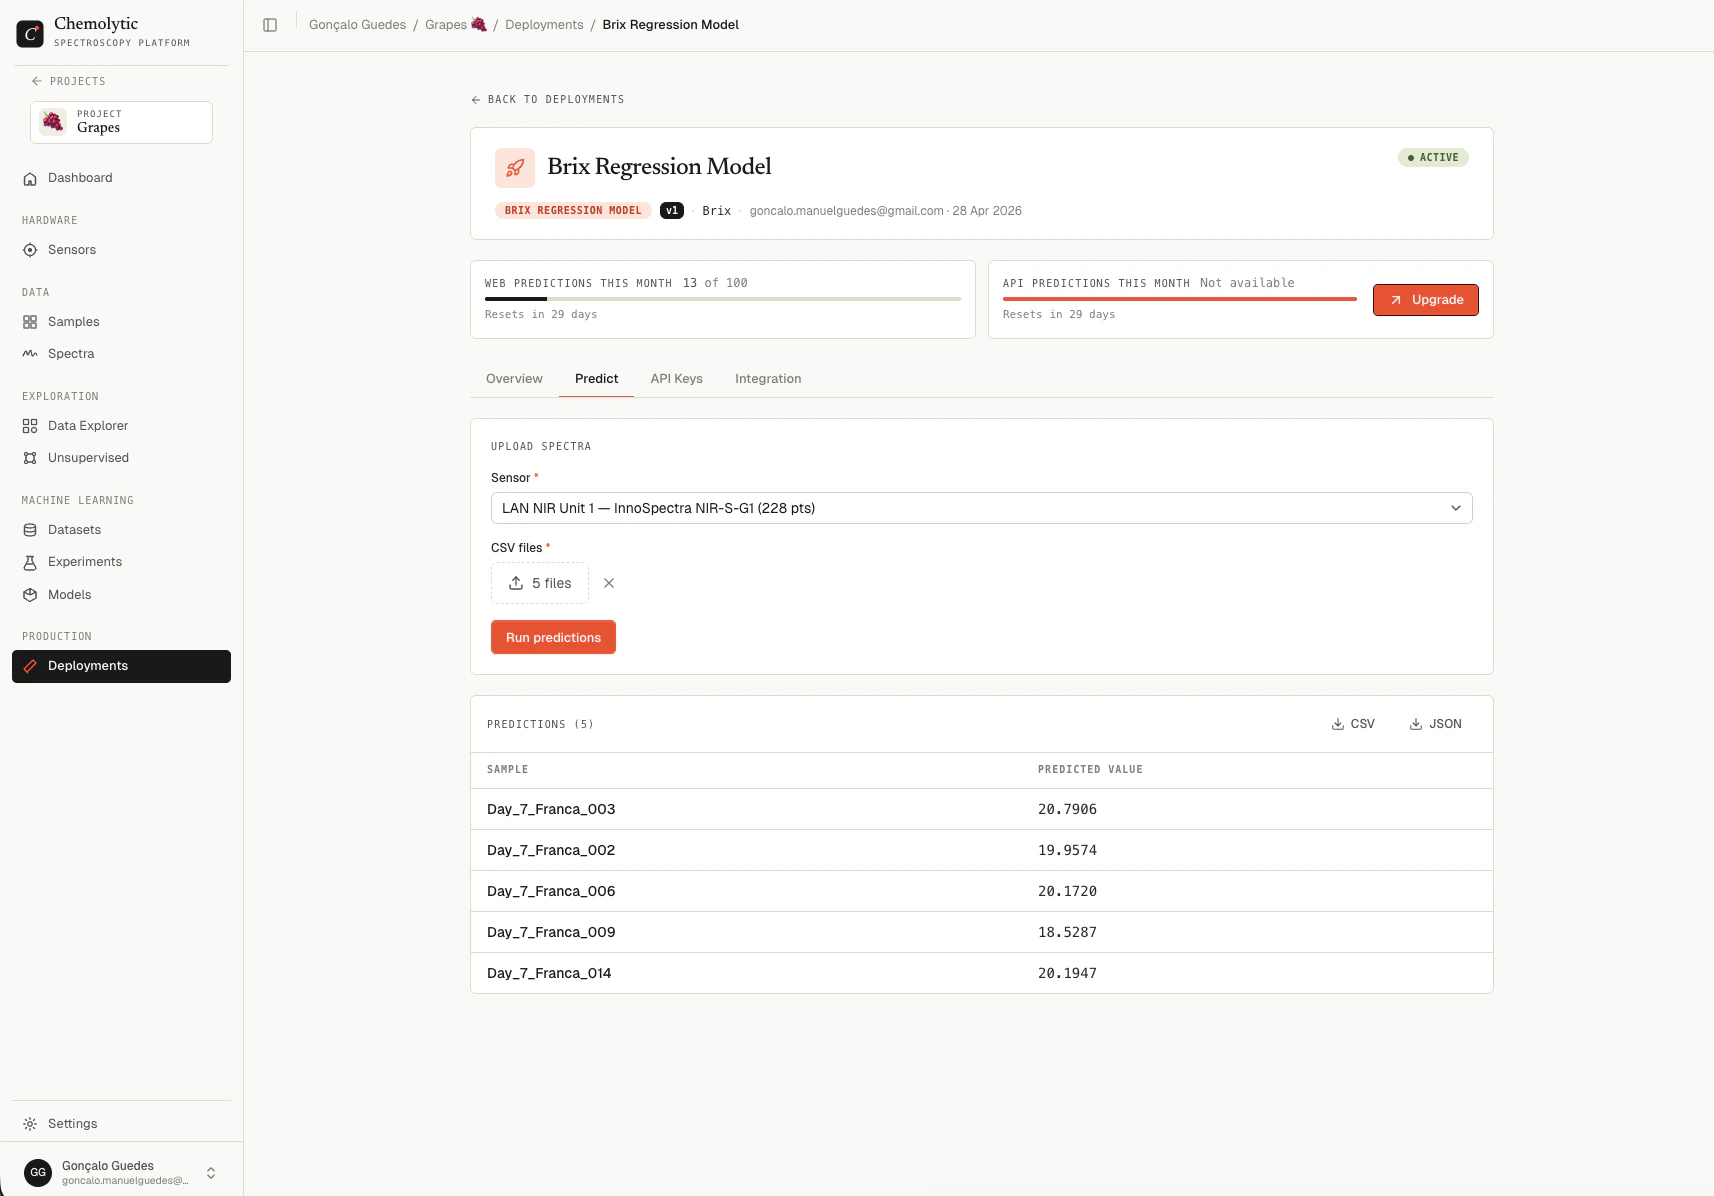
Step 1: pick a sensor
The sensor dropdown shows all sensors in the project. Each option includes the sensor name, model name, and number of points.Step 2: upload spectra
Drag and drop CSV files into the upload zone, or click to browse. Multiple files at once are supported. The format depends on the sensor:- Catalog sensor: use the raw file format your instrument exports
- Custom sensor: use the standard CSV format (long format with
sample_name,x,ycolumns)
Step 3: run predictions
Click Run predictions. The button is disabled until you have both a sensor and at least one file selected. While predictions are running, the button shows a loading state. Behind the scenes, Chemolytic:- Parses each file using the sensor’s importer
- Validates the point count matches the model’s expected input
- Sends the spectra to the model
- Returns one prediction per spectrum
Step 4: read the results
A results table appears below the upload zone.
For regression models, values are shown to 4 decimal places. For classification, the predicted category is shown as a label.
Downloads
Two buttons appear above the table:
Use these to bring predictions into your downstream workflow (LIMS, Excel, custom report).
Validation errors
Spectrum 'X' has 500 points, expected 512
Spectrum 'X' has 500 points, expected 512
The CSV doesn’t match the model’s expected input size. Either you picked the wrong sensor, or the file is from a different instrument configuration. Use the sensor that matches the file.
Deployment is not active
Deployment is not active
The deployment is currently inactive. Toggle it active in the Overview tab and try again.
Model not ready
Model not ready
The underlying model is still building or failed. Wait for it to finish (or check the model detail page for an error).
Monthly prediction limit exceeded
Monthly prediction limit exceeded
You’ve used all your web predictions for this month. The error message shows your limit, used count, and how much you tried to submit. Wait for the next billing cycle or upgrade your plan.
Spectrum has NaN or Inf values
Spectrum has NaN or Inf values
One of your spectra contains invalid numbers. Check the source file; this is usually a parsing or instrument issue.
Plan limits
Each web prediction counts againstmax_webapp_predictions_month. The current count and limit are shown at the top of the deployment detail page.
When you exceed the limit mid-batch, the entire batch is rejected (you don’t get partial results). The error message shows exactly how many you tried to submit and how many remain.