> ## Documentation Index
> Fetch the complete documentation index at: https://docs.chemolytic.com/llms.txt
> Use this file to discover all available pages before exploring further.
# Quickstart
> Go from raw spectra to a deployed prediction model in 10 minutes.
This guide walks you through the entire workflow, from uploading data to deploying a model that makes predictions. Follow along step by step.
***
## Step 1: Create an account
1. Go to the Chemolytic app and click **Sign Up**
2. Enter your email and create a password
3. Check your inbox and click the verification link
4. You'll be automatically logged in and a **personal organization** will be created for you
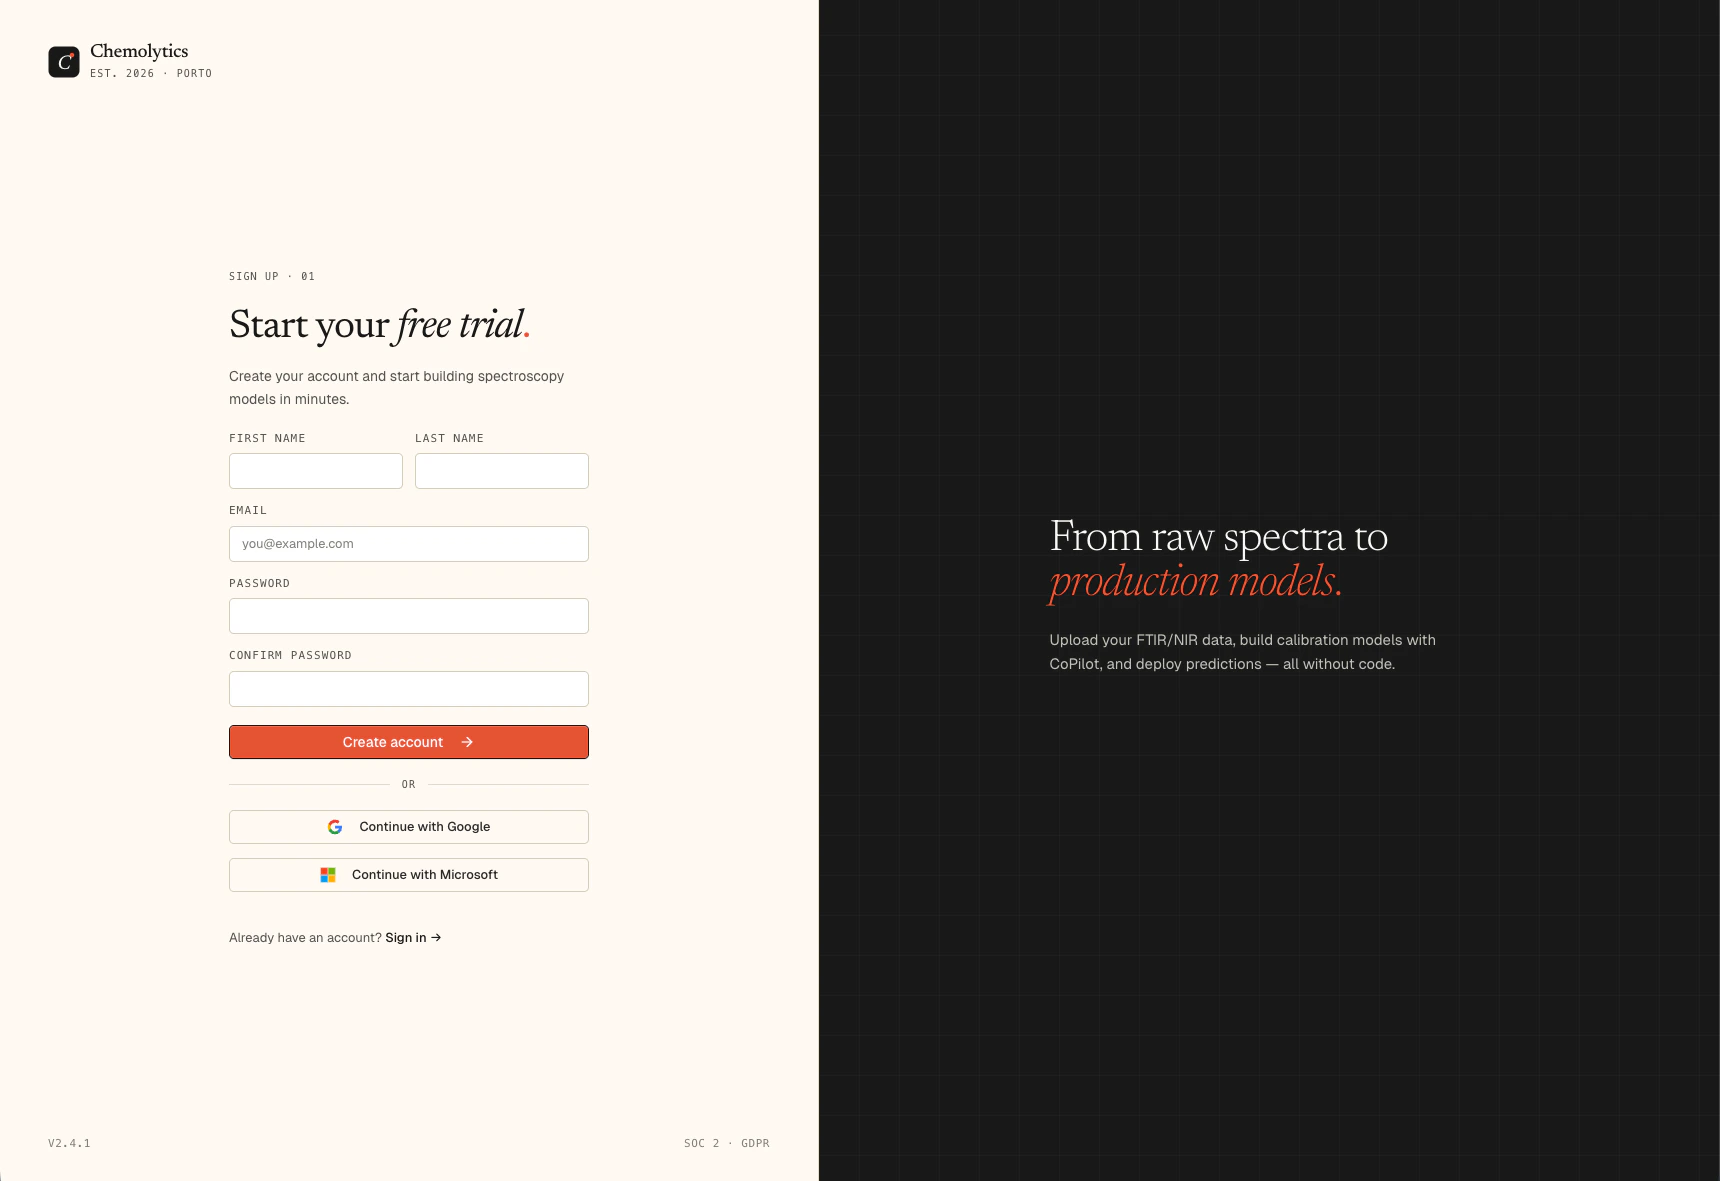 Your personal organization comes with the **Free plan**: 1 project, 1 member. You can upgrade later from the Billing page.
***
## Step 2: Create a project
1. After logging in, you'll see the **Projects** page
2. Click **New Project**
3. Give it a name (e.g., "Olive Oil Quality") and an optional description
4. Click **Create**
Your personal organization comes with the **Free plan**: 1 project, 1 member. You can upgrade later from the Billing page.
***
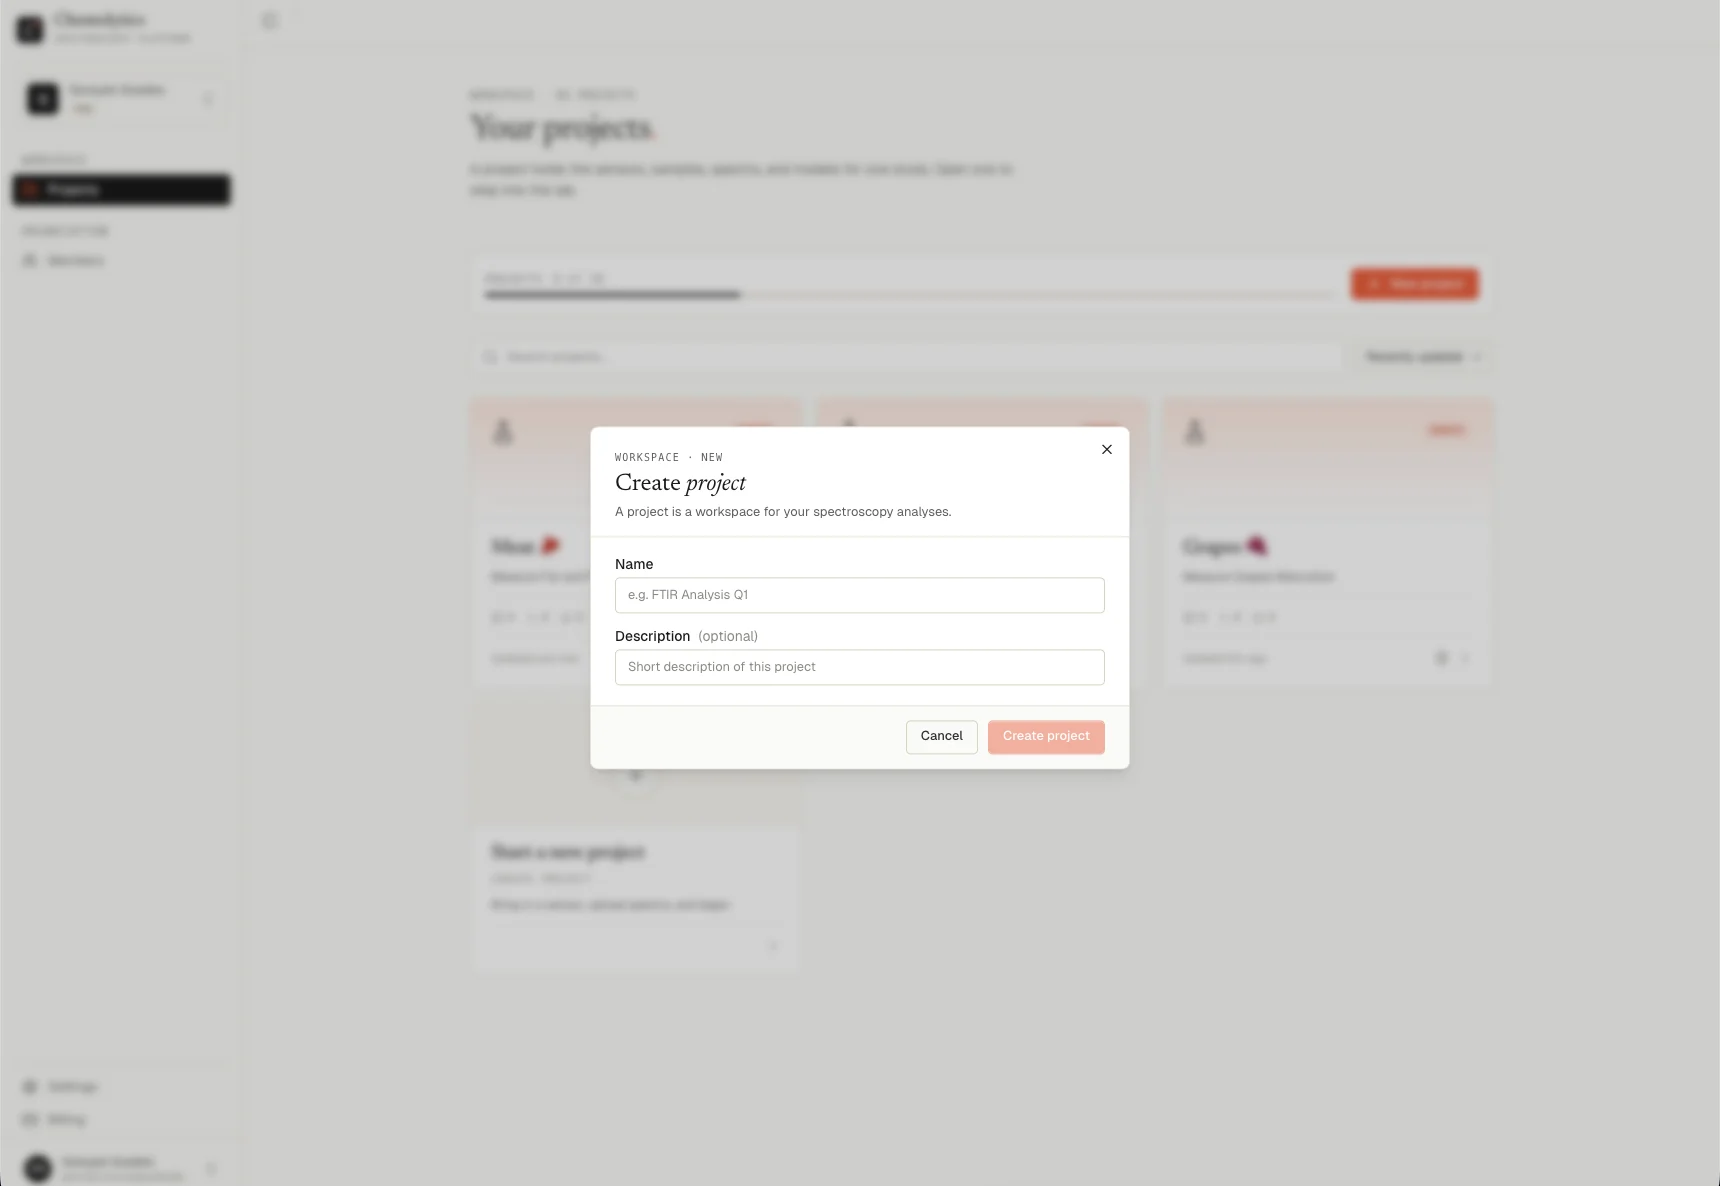
## Step 2: Create a project
1. After logging in, you'll see the **Projects** page
2. Click **New Project**
3. Give it a name (e.g., "Olive Oil Quality") and an optional description
4. Click **Create**
 ***
## Step 3: Set up a sensor
Your spectra come from a physical instrument. You need to tell Chemolytic which one.
1. In your project, go to **Sensors** in the sidebar
2. Click **New Sensor**
3. Choose from the **catalog** (e.g., select "NIR") or create a **custom** sensor
4. Fill in the details and click **Create**
***
## Step 3: Set up a sensor
Your spectra come from a physical instrument. You need to tell Chemolytic which one.
1. In your project, go to **Sensors** in the sidebar
2. Click **New Sensor**
3. Choose from the **catalog** (e.g., select "NIR") or create a **custom** sensor
4. Fill in the details and click **Create**
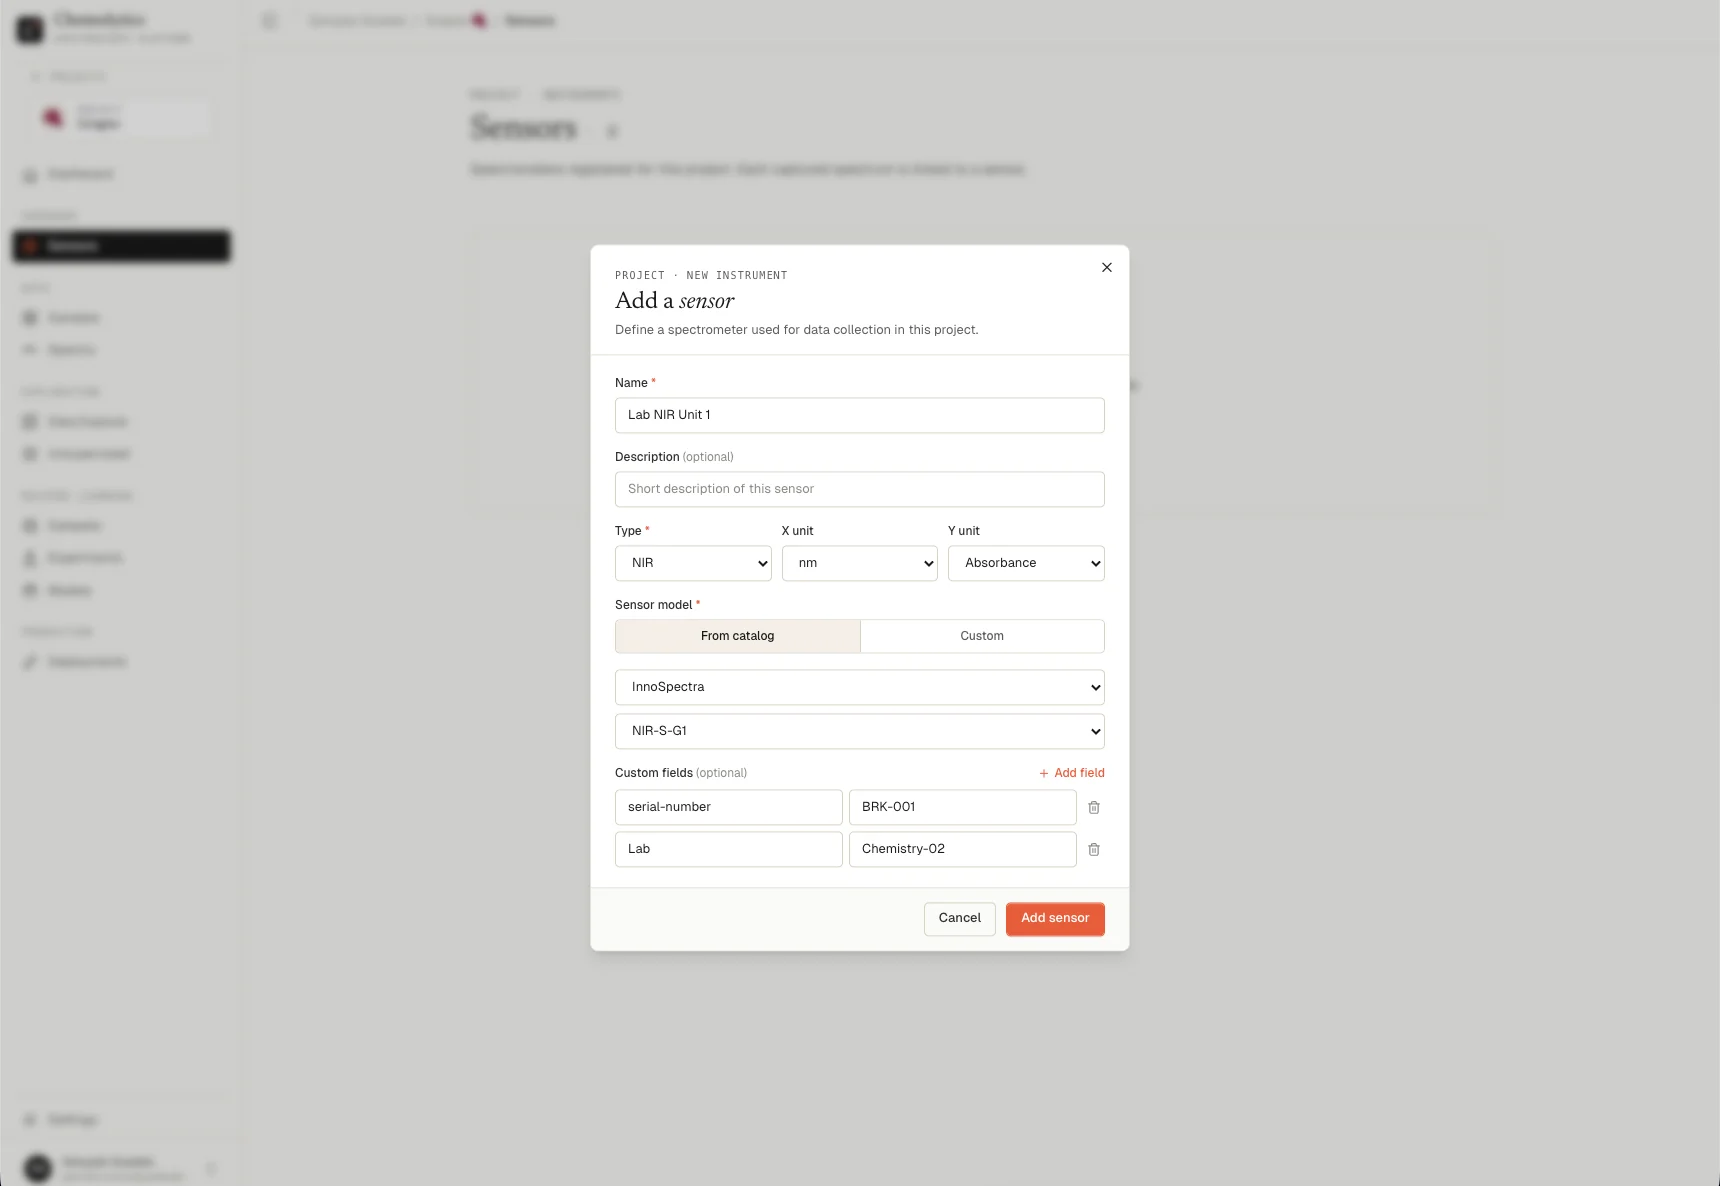 If you select an instrument from the catalog, most fields will be filled automatically. If your instrument is not listed, choose Custom and enter the specifications manually.
For catalog instruments, sensor configurations are predefined and raw data can be imported automatically. For custom instruments, the data must be converted into a standard format before it can be processed.
***
## Step 4: Create samples and properties
Samples are the physical items you measured (e.g., "Olive Oil Sample #1"). Properties are what you want to predict (e.g., "Acidity").
### Create a property first
1. Go to **Samples** in the sidebar
2. Click the **Properties** tab
3. Click **New Property**
4. Enter a name (e.g., "Acidity"), select a type, and optionally add a unit (e.g., "% w/w")
* Choose **Continuous** for numeric values
* Choose **Categorical** for discrete labels (you must define at least two categories)
If you select an instrument from the catalog, most fields will be filled automatically. If your instrument is not listed, choose Custom and enter the specifications manually.
For catalog instruments, sensor configurations are predefined and raw data can be imported automatically. For custom instruments, the data must be converted into a standard format before it can be processed.
***
## Step 4: Create samples and properties
Samples are the physical items you measured (e.g., "Olive Oil Sample #1"). Properties are what you want to predict (e.g., "Acidity").
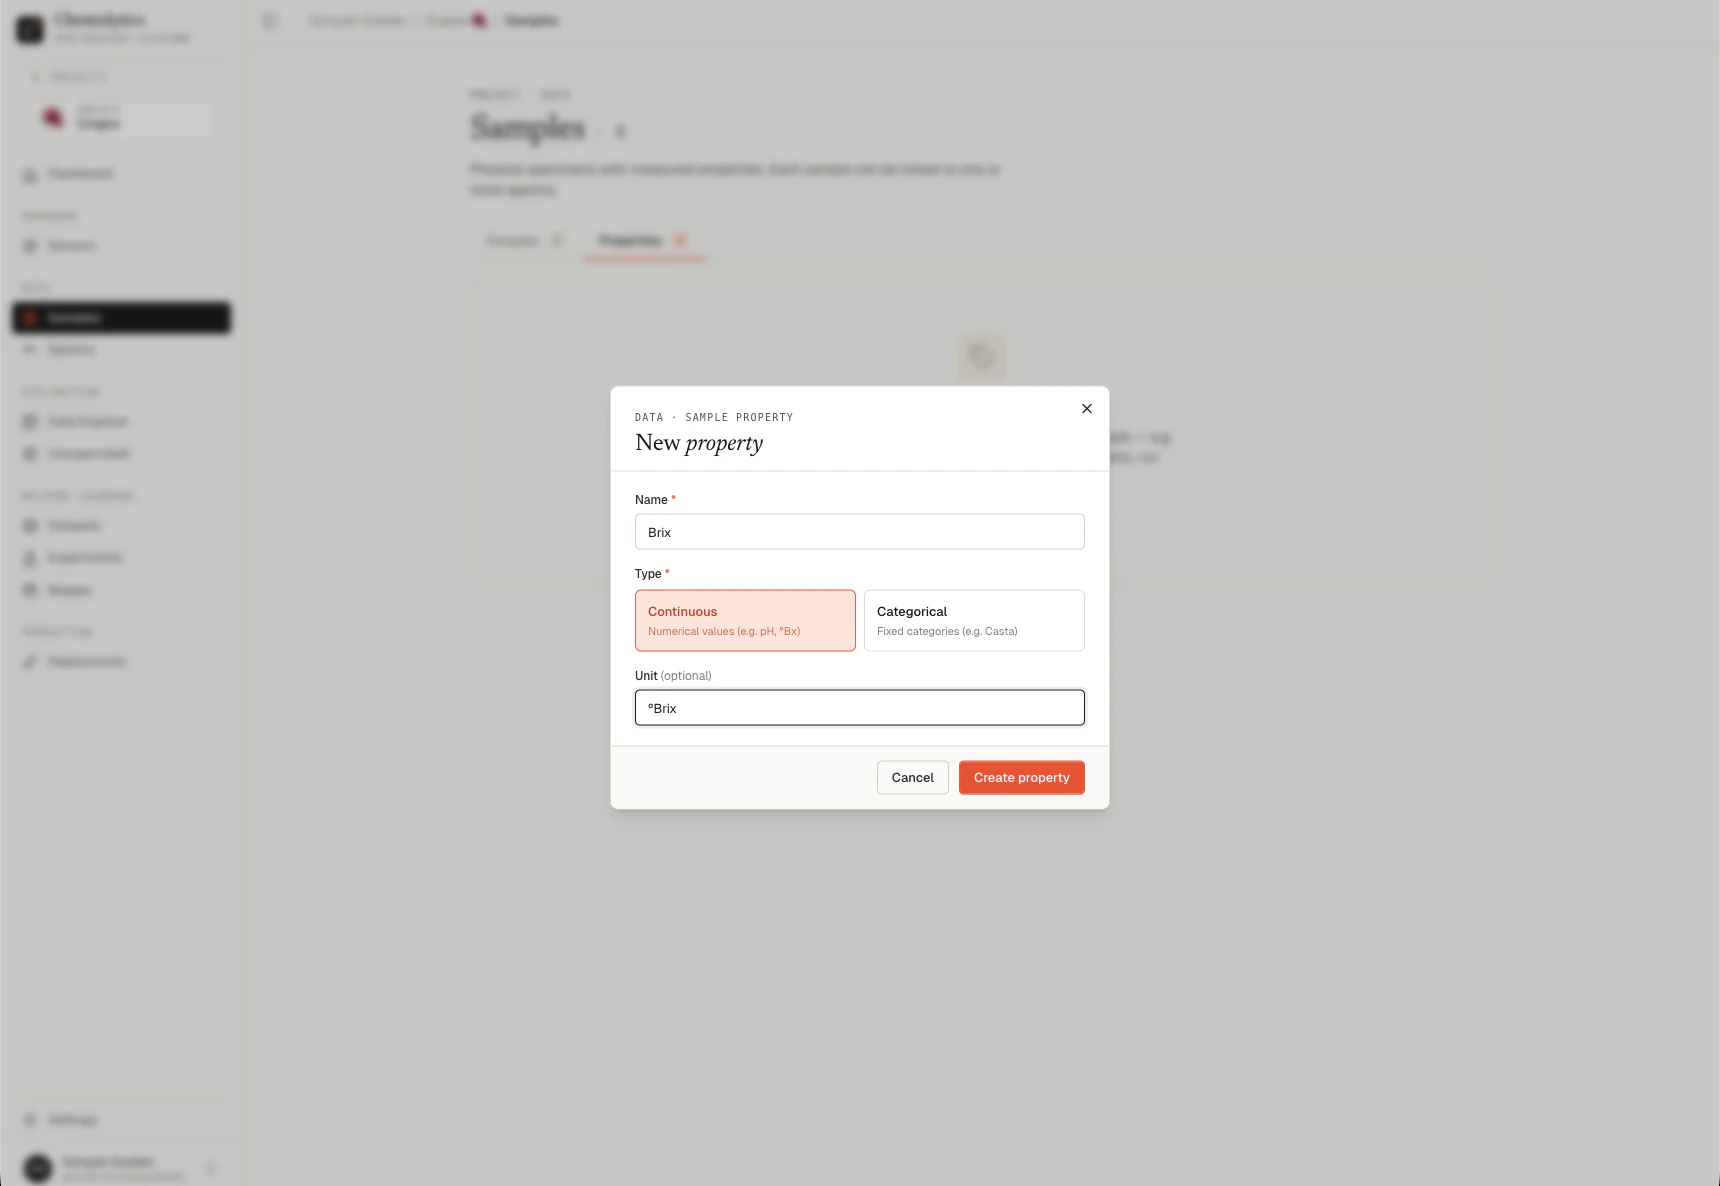
### Create a property first
1. Go to **Samples** in the sidebar
2. Click the **Properties** tab
3. Click **New Property**
4. Enter a name (e.g., "Acidity"), select a type, and optionally add a unit (e.g., "% w/w")
* Choose **Continuous** for numeric values
* Choose **Categorical** for discrete labels (you must define at least two categories)
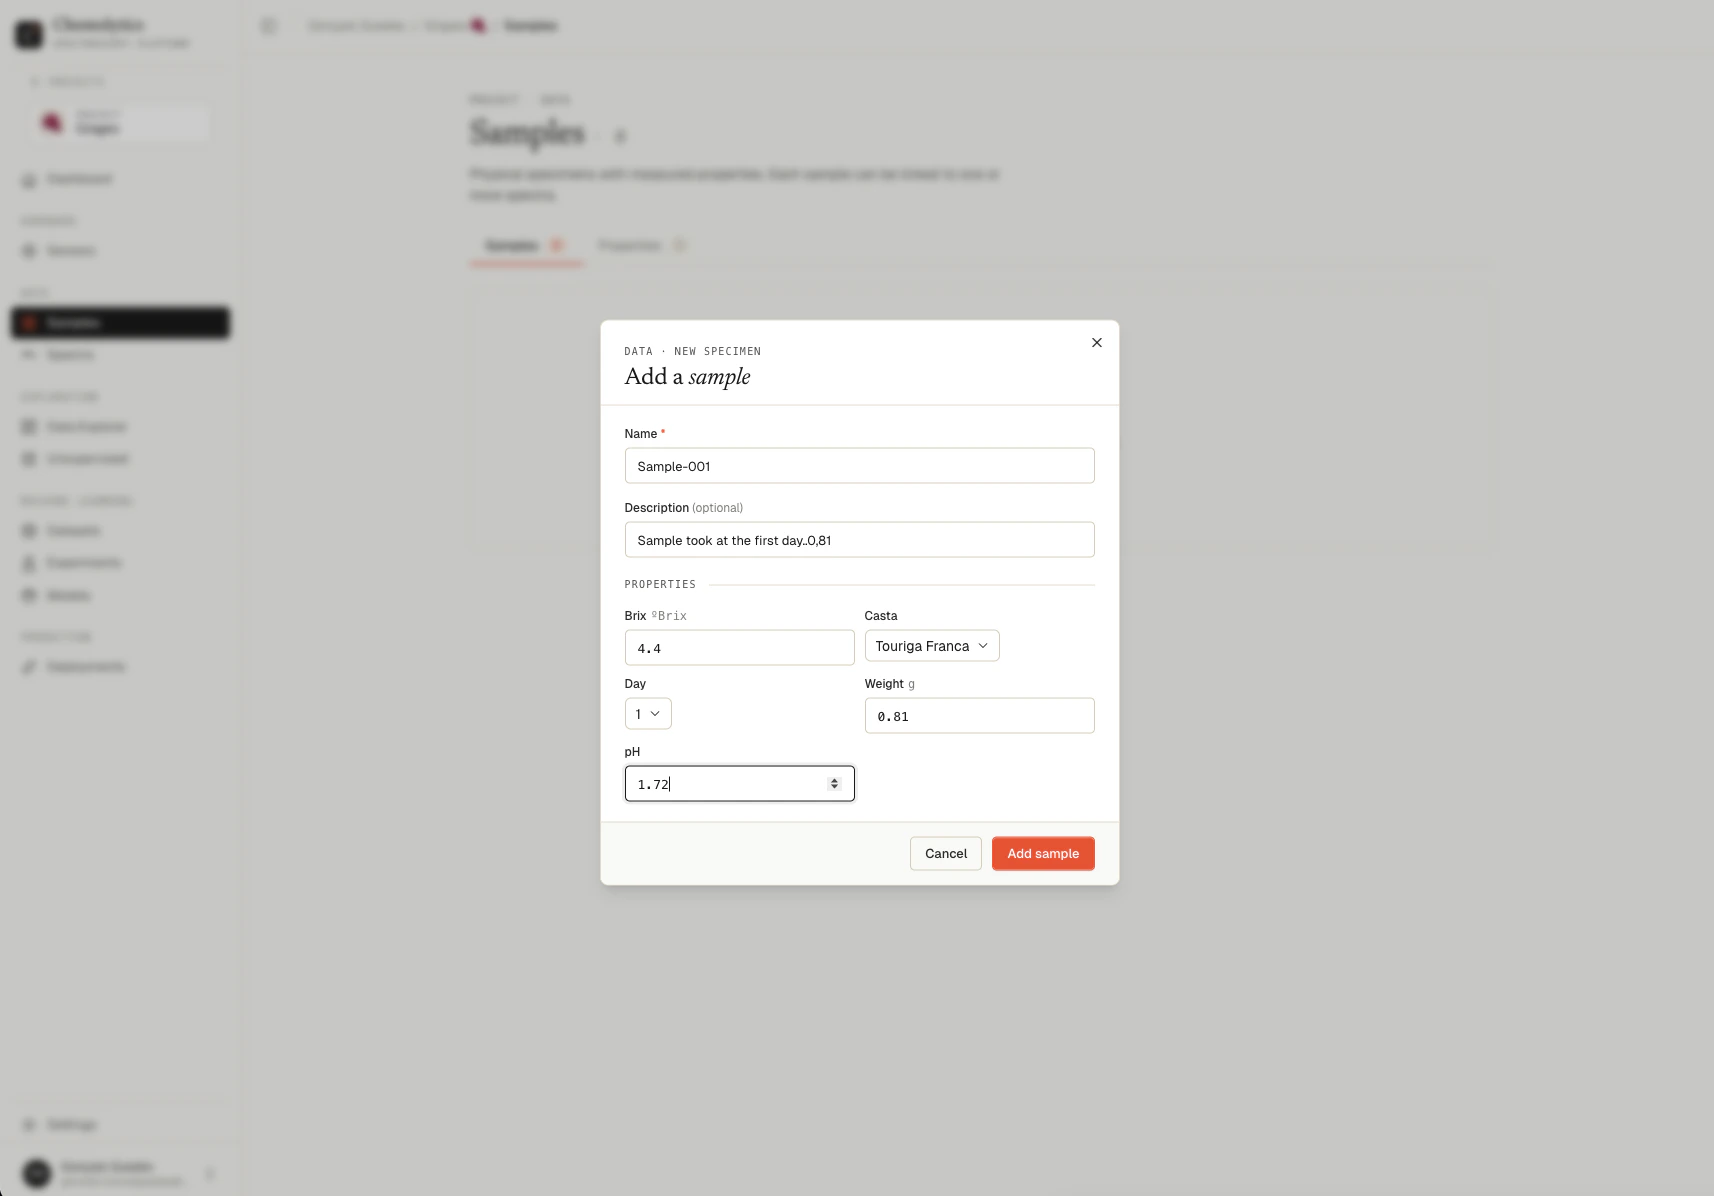
 ### Create samples
1. Switch to the **Samples** tab
2. Click **New Sample**
3. Enter a name and the property values for this sample (e.g., Acidity = 0.35)
4. Repeat for all your samples
### Create samples
1. Switch to the **Samples** tab
2. Click **New Sample**
3. Enter a name and the property values for this sample (e.g., Acidity = 0.35)
4. Repeat for all your samples
 You need at least 10-20 samples with property values for reliable modelling. The more diverse your samples, the better your model will generalize.
***
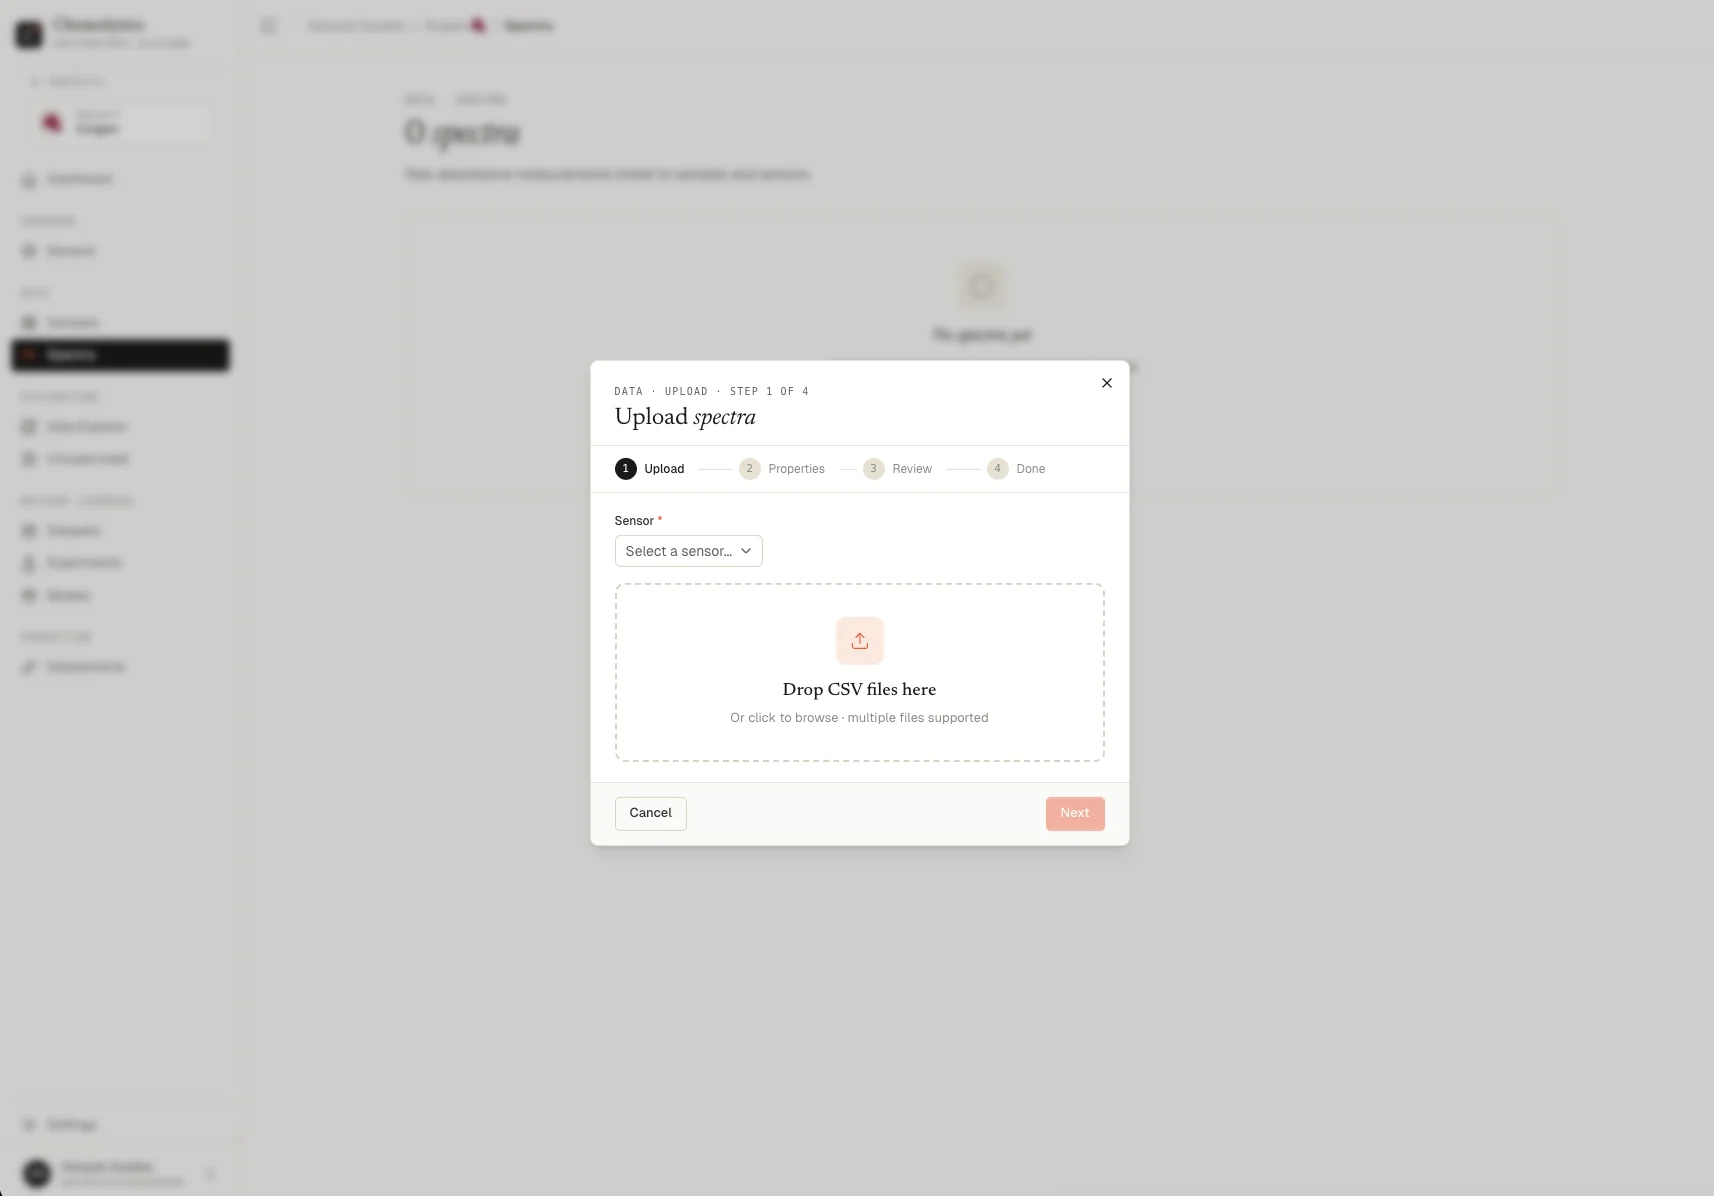
## Step 5: Upload spectra
1. Go to **Spectra** in the sidebar
2. Click **Upload Spectra**
3. Select the **sensor** you created in Step 3
4. Upload the CSV file exported from your sensor and click **Confirm**
You need at least 10-20 samples with property values for reliable modelling. The more diverse your samples, the better your model will generalize.
***
## Step 5: Upload spectra
1. Go to **Spectra** in the sidebar
2. Click **Upload Spectra**
3. Select the **sensor** you created in Step 3
4. Upload the CSV file exported from your sensor and click **Confirm**
 After uploading, you'll see your spectra plotted as interactive line charts.
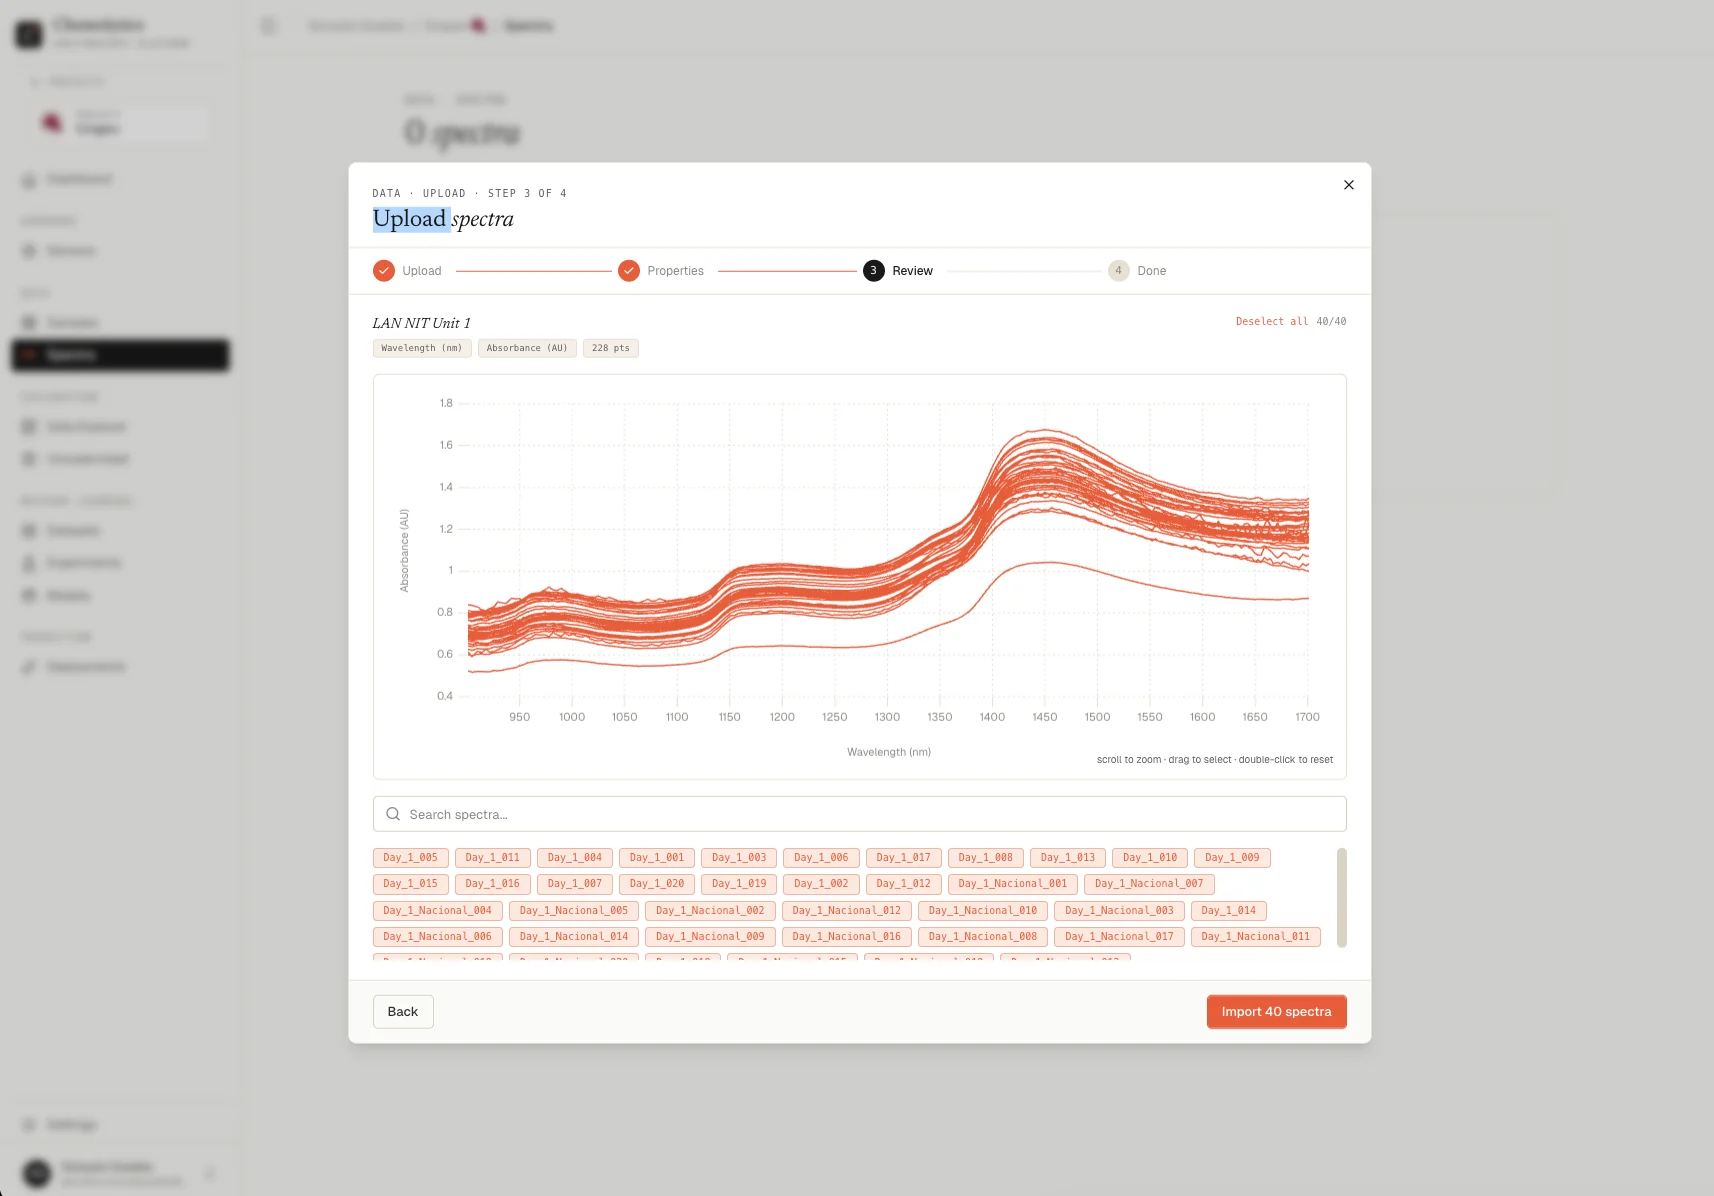 The upload flow has more options: sample mapping, property extraction from filenames, and more. See [Uploading spectra](/guides/uploading-spectra) for the full guide.
***
## Step 6: Explore your data (optional)
Before modelling, it's worth checking if your data is ready and looking for patterns or outliers.
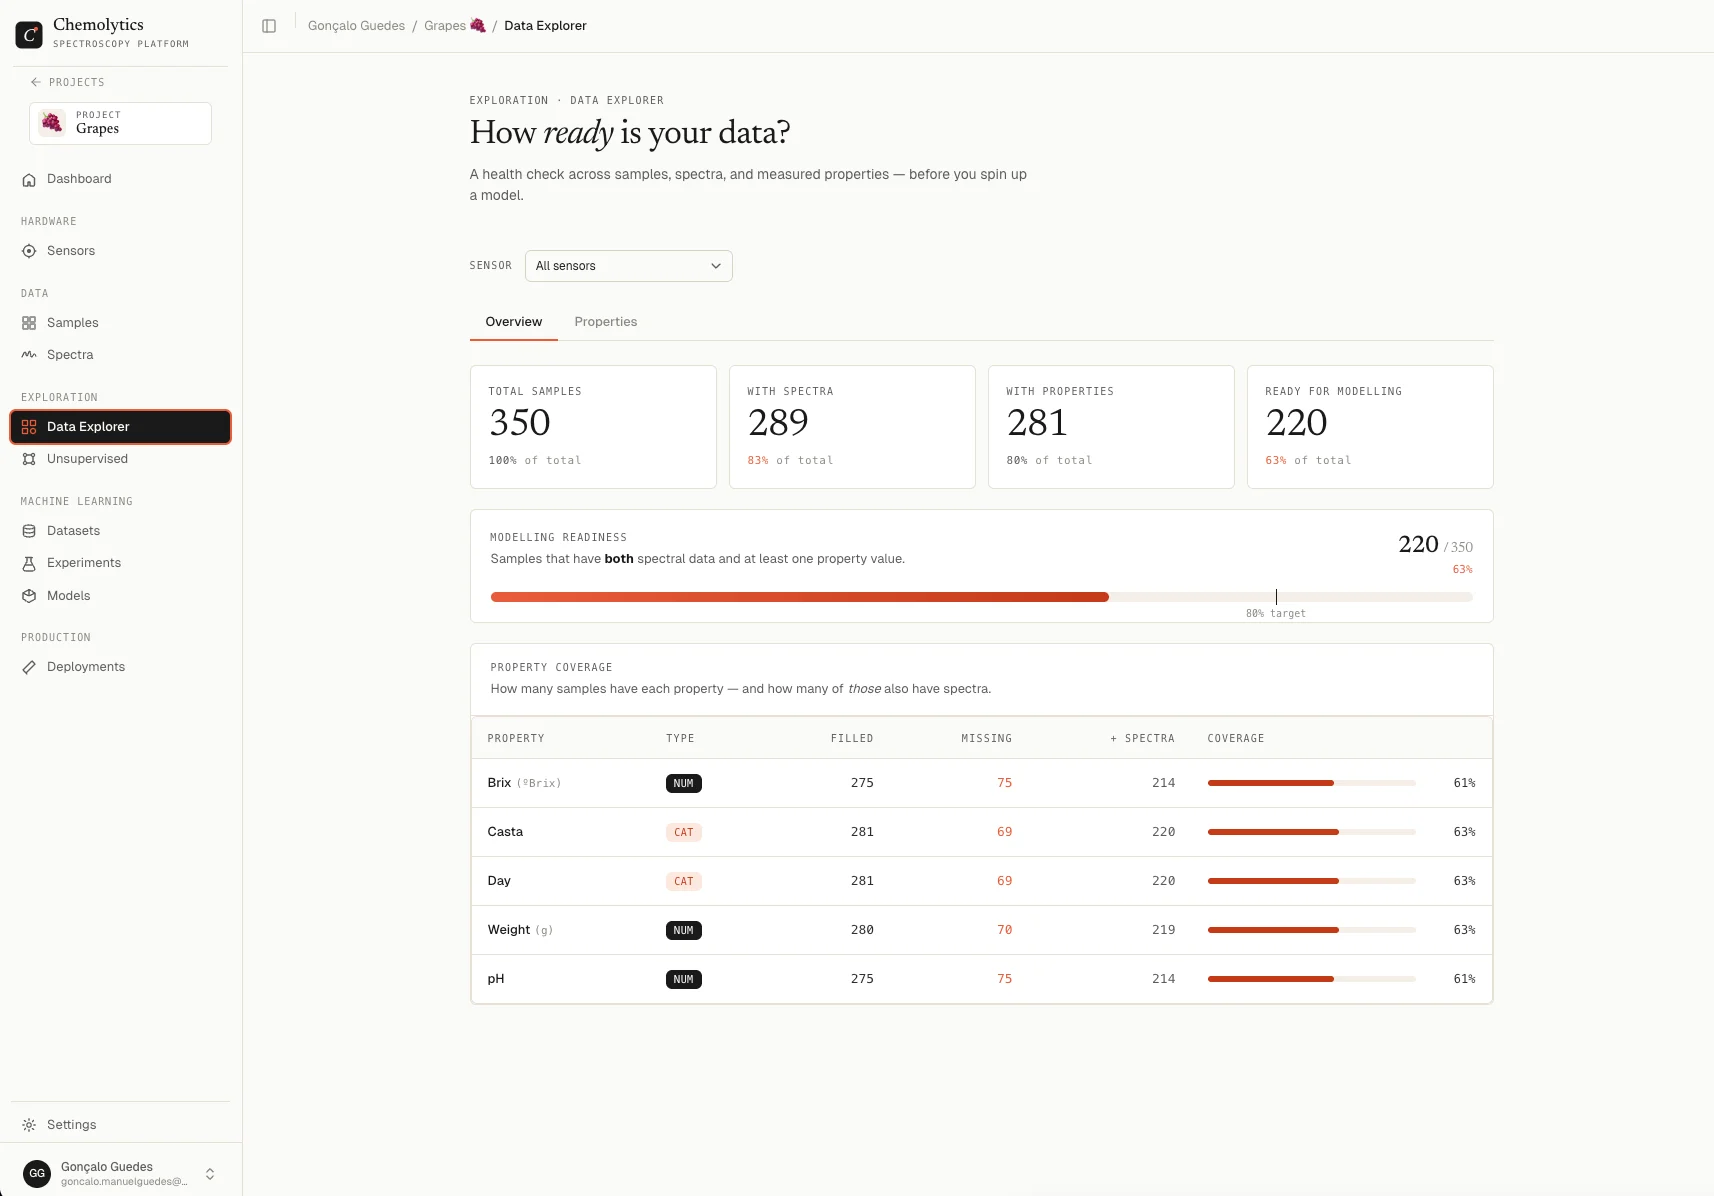
### Data Explorer
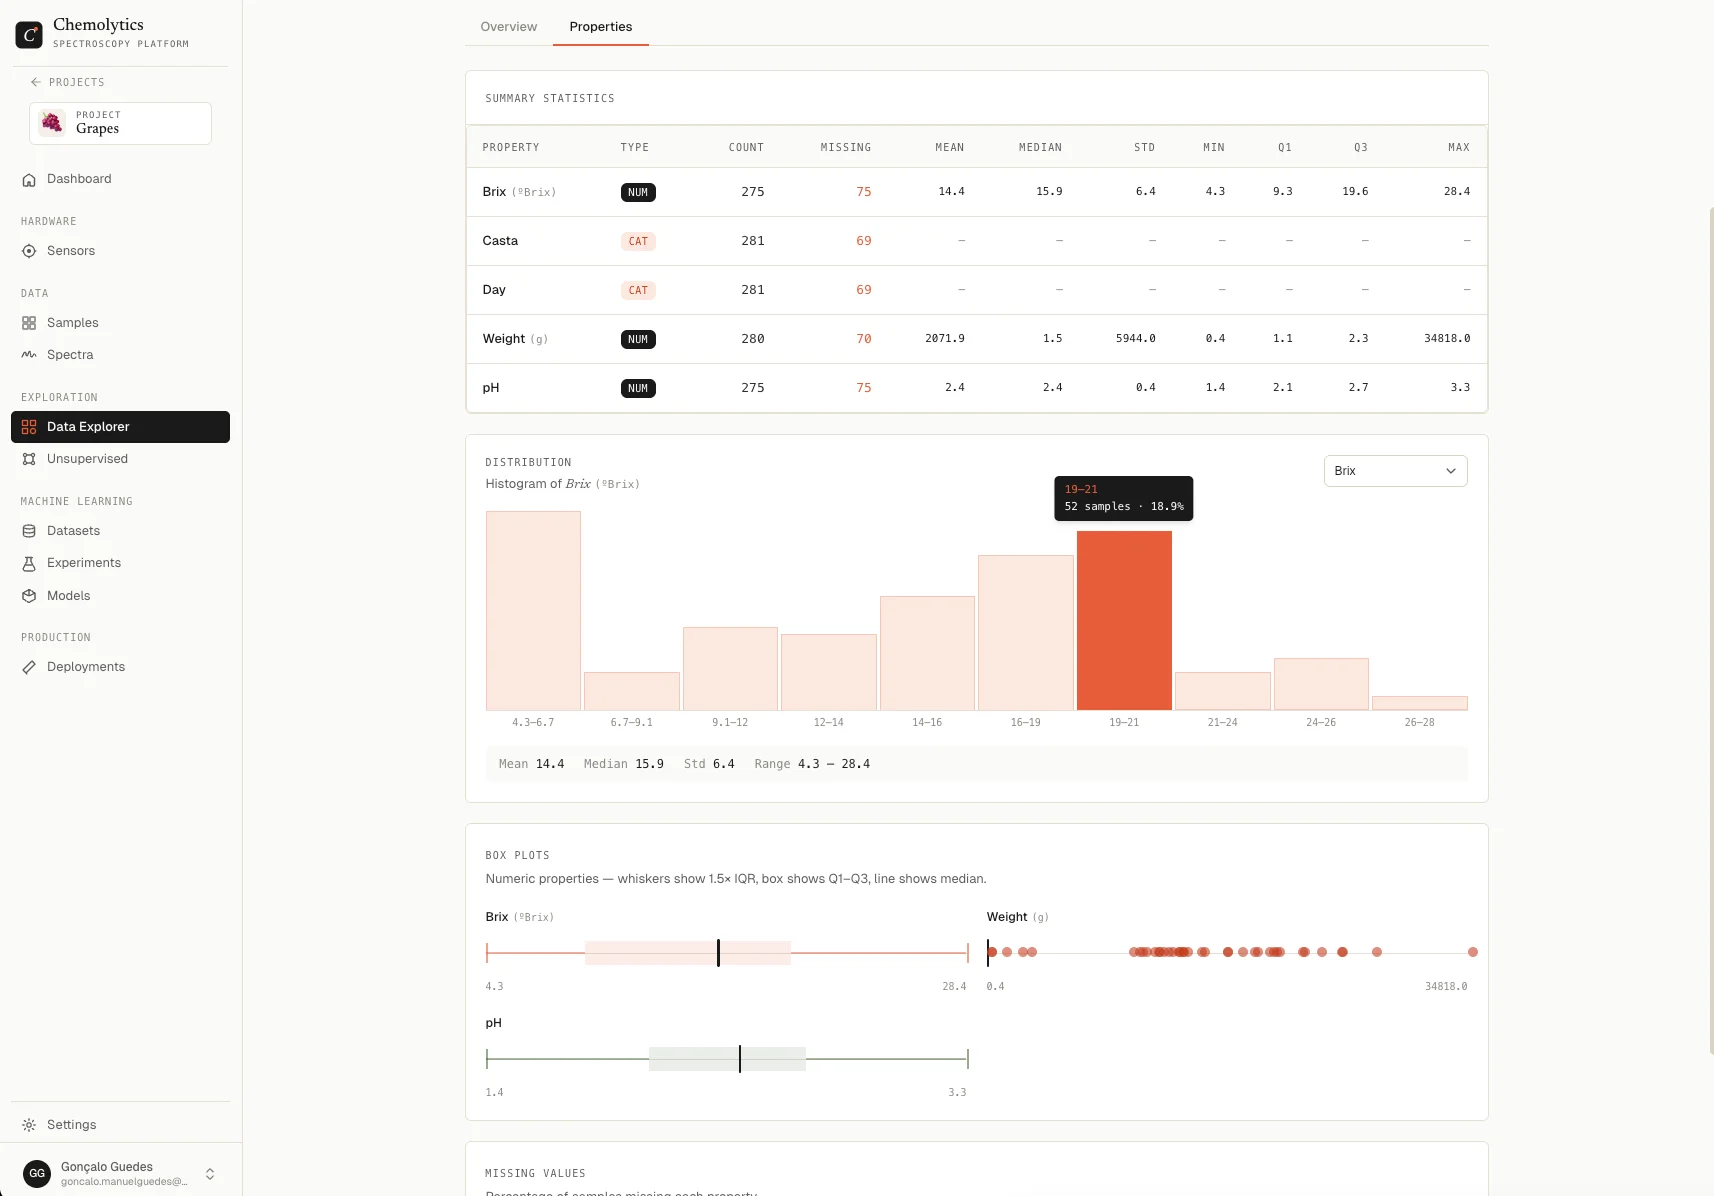
1. Go to **Data Explorer** in the sidebar
2. Check the **Modelling Readiness** score. It shows how many samples have both spectra and property values
3. Switch to the **Properties** tab to see summary statistics and distributions for each property
The upload flow has more options: sample mapping, property extraction from filenames, and more. See [Uploading spectra](/guides/uploading-spectra) for the full guide.
***
## Step 6: Explore your data (optional)
Before modelling, it's worth checking if your data is ready and looking for patterns or outliers.
### Data Explorer
1. Go to **Data Explorer** in the sidebar
2. Check the **Modelling Readiness** score. It shows how many samples have both spectra and property values
3. Switch to the **Properties** tab to see summary statistics and distributions for each property
 ### Unsupervised analysis
1. Go to **Unsupervised** in the sidebar
2. Click **New Analysis**, select your sensor and spectra
3. Click **New Run**, choose a method (PCA, t-SNE, or K-Means), pick a preprocessing pipeline, and run
4. Inspect the scatter plot, colour it by a property to spot groupings and outliers
### Unsupervised analysis
1. Go to **Unsupervised** in the sidebar
2. Click **New Analysis**, select your sensor and spectra
3. Click **New Run**, choose a method (PCA, t-SNE, or K-Means), pick a preprocessing pipeline, and run
4. Inspect the scatter plot, colour it by a property to spot groupings and outliers
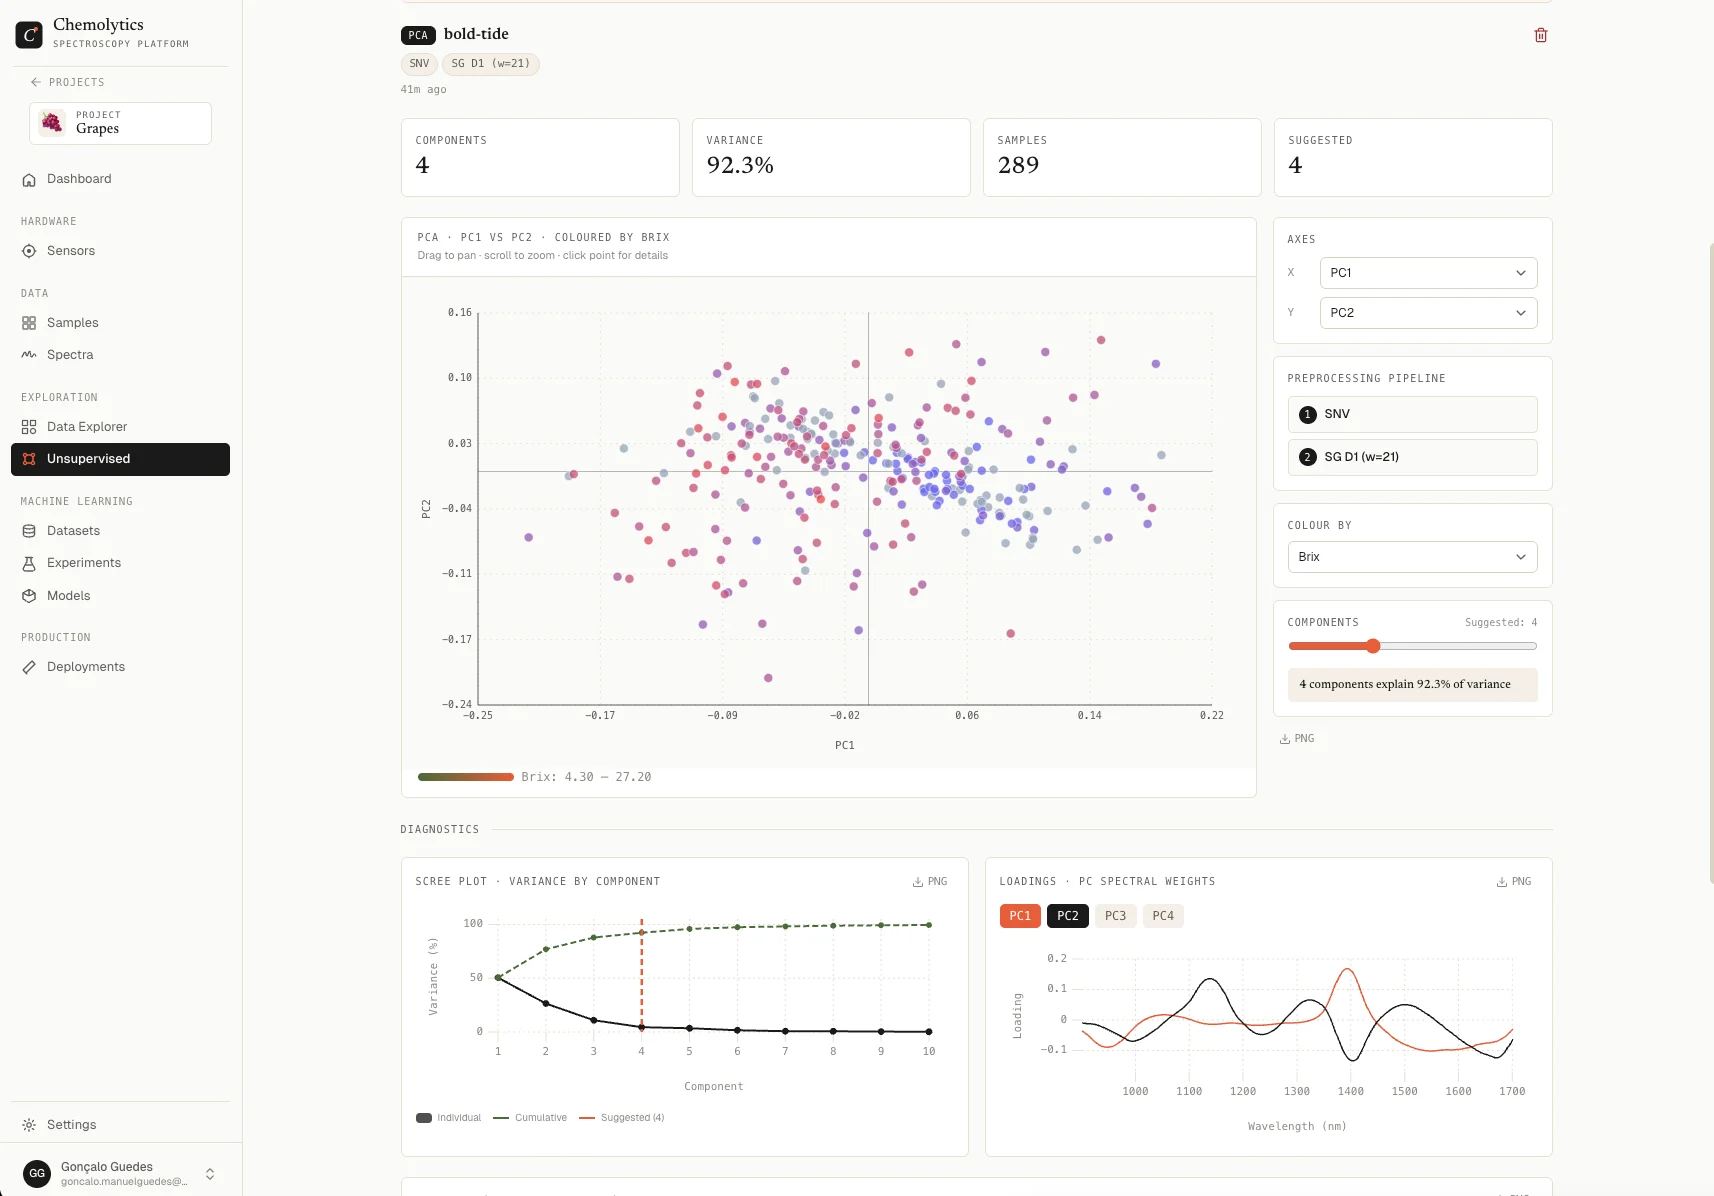 If you see obvious outliers or clusters that don't match your expectations, investigate before building a dataset. Bad samples in, bad model out.
***
## Step 7: Create a dataset
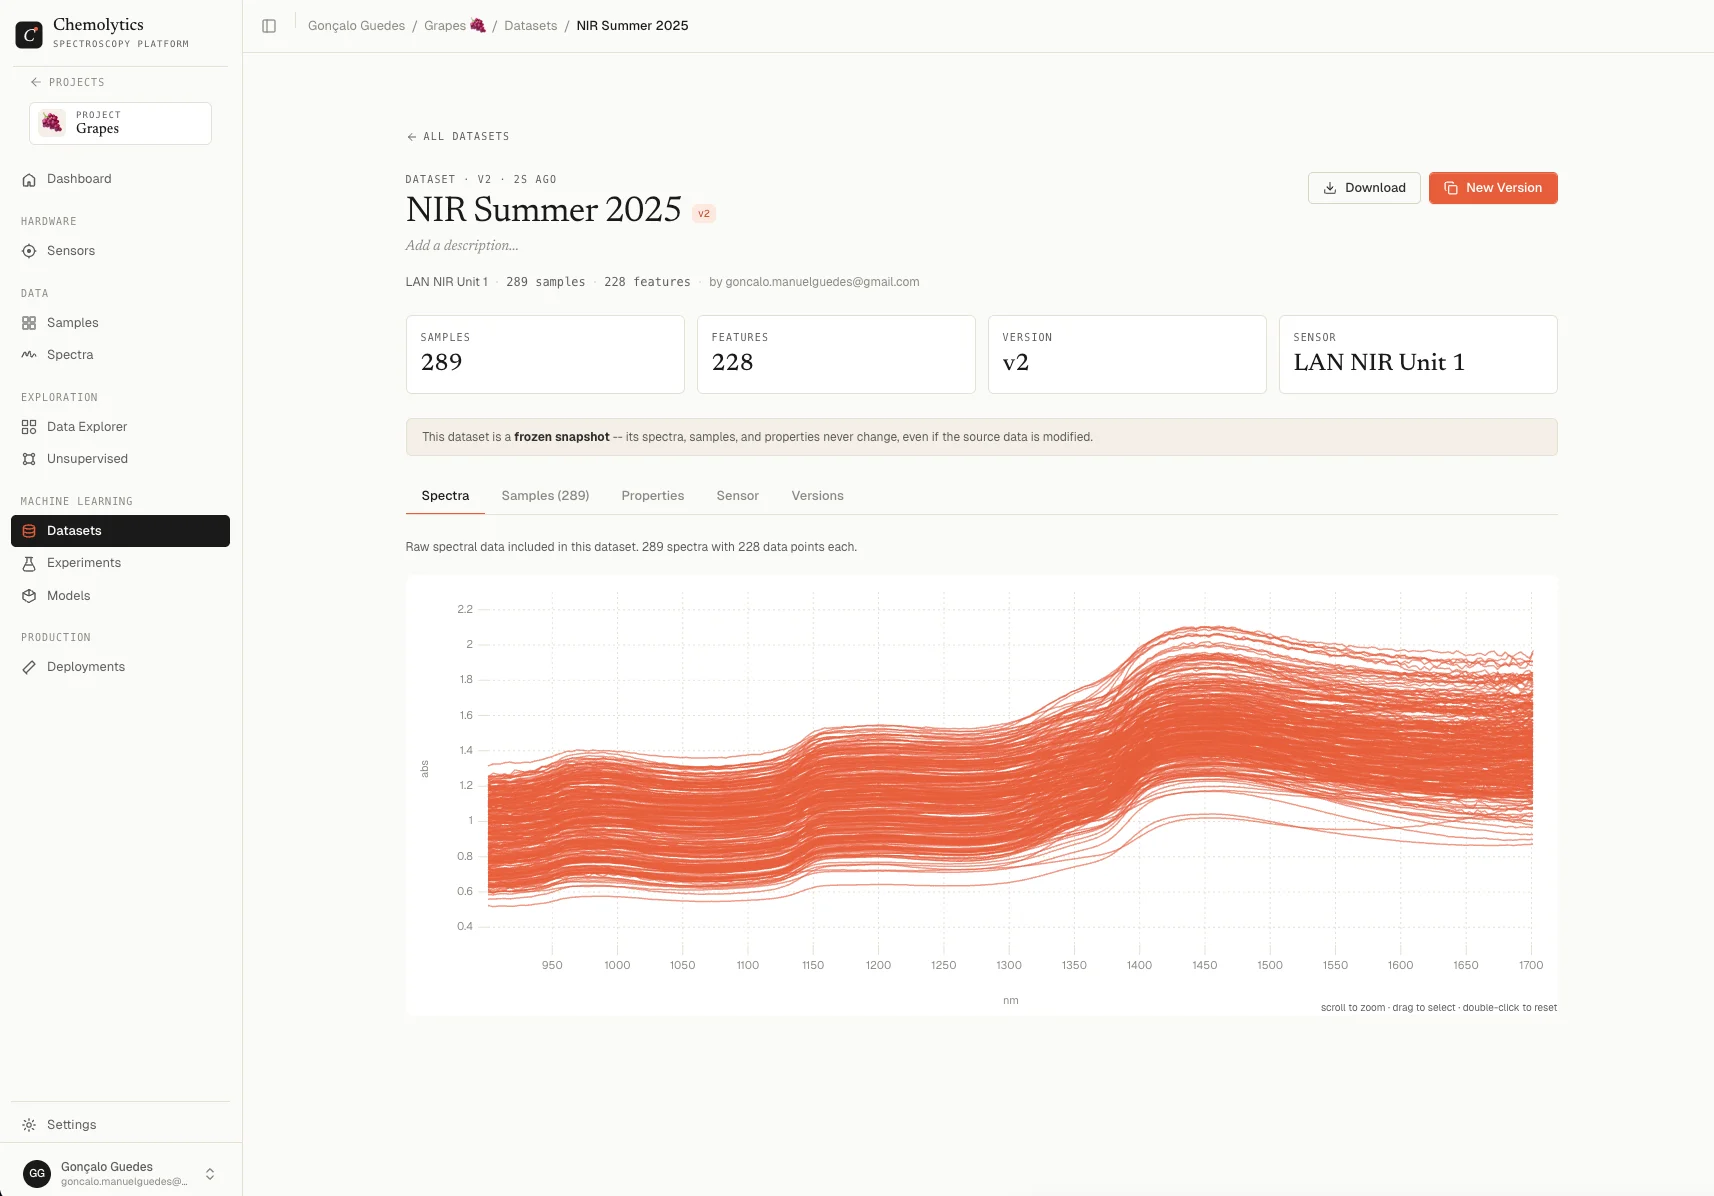
A dataset bundles your spectra with their sample properties into a ready-to-model package.
1. Go to **Datasets** in the sidebar
2. Click **New Dataset**
3. Select the **sensor** and the **samples** to include
4. Give it a name and click **Create**
If you see obvious outliers or clusters that don't match your expectations, investigate before building a dataset. Bad samples in, bad model out.
***
## Step 7: Create a dataset
A dataset bundles your spectra with their sample properties into a ready-to-model package.
1. Go to **Datasets** in the sidebar
2. Click **New Dataset**
3. Select the **sensor** and the **samples** to include
4. Give it a name and click **Create**
 ***
## Step 8: Run an experiment (CoPilot mode)
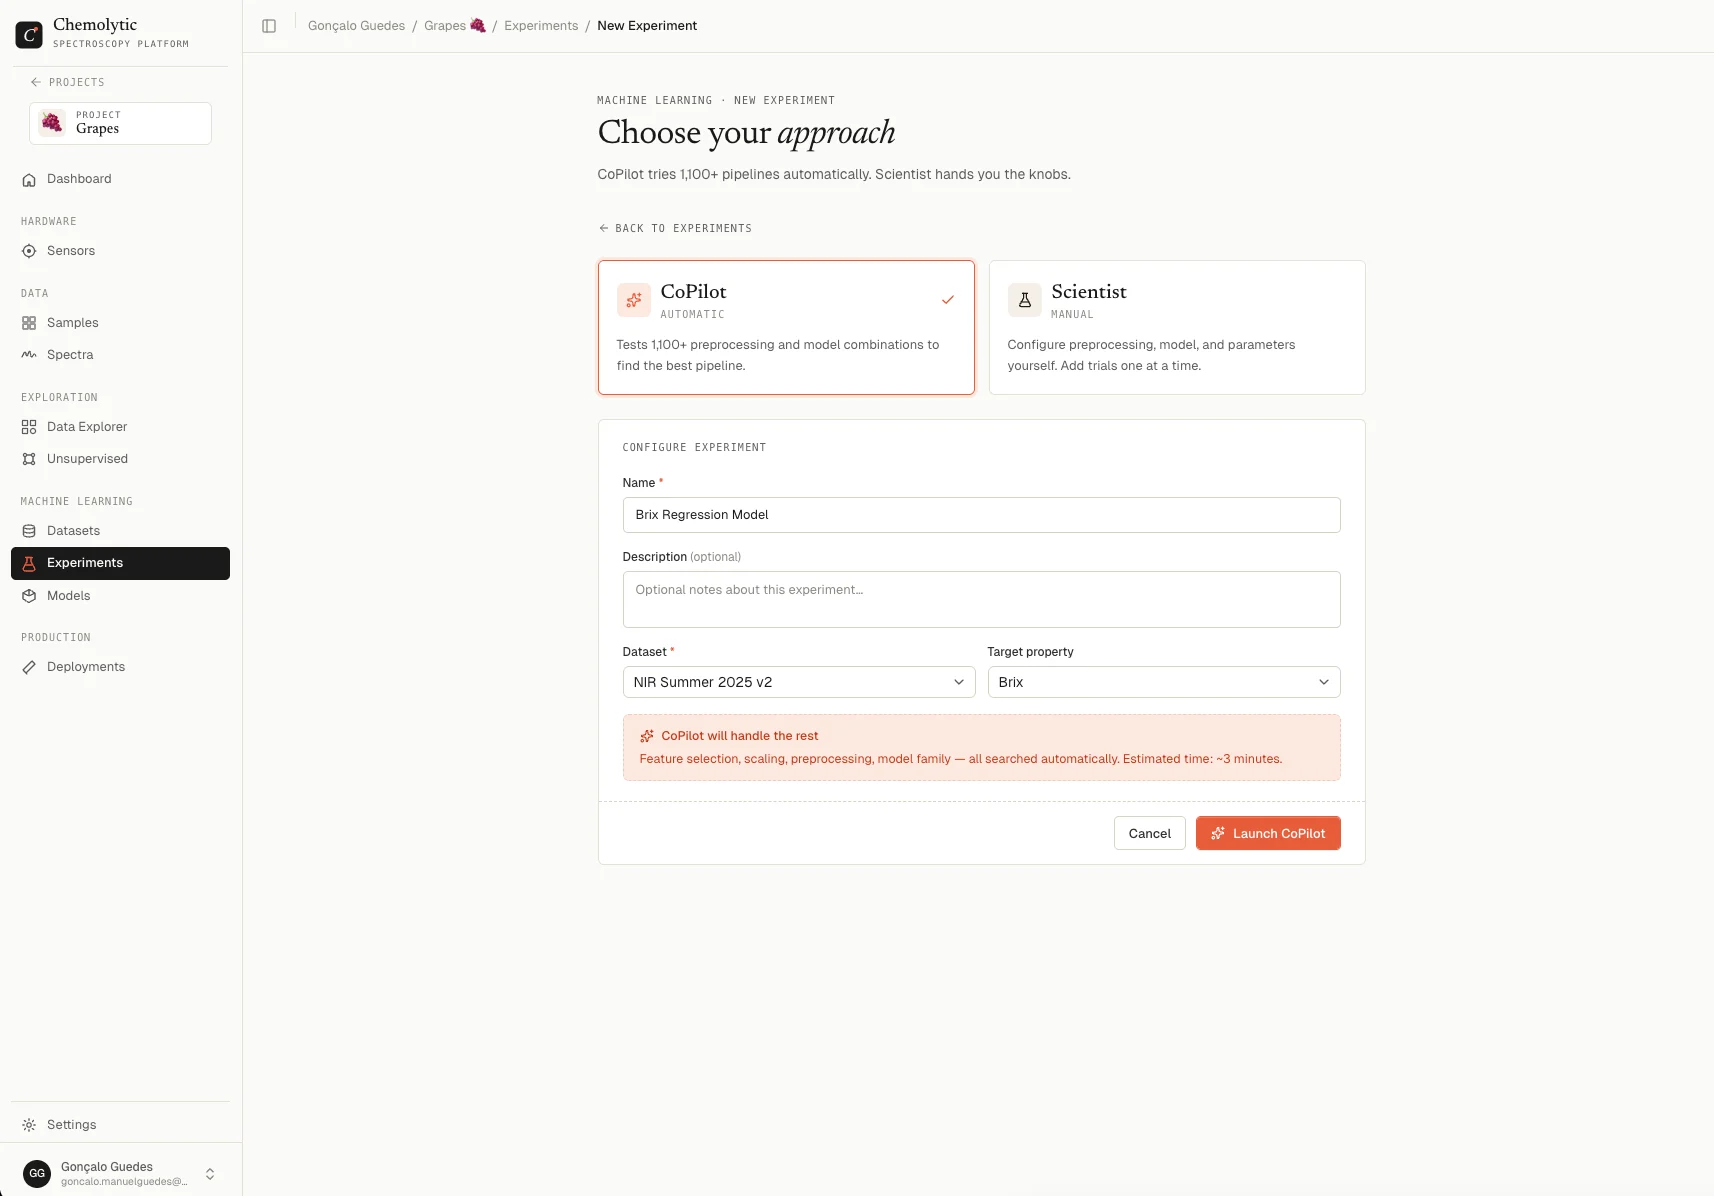
CoPilot automatically finds the best model for your data.
1. Go to **Experiments** in the sidebar
2. Click **New Experiment**
3. Select **CoPilot** mode
4. Choose your dataset and the **target property** you want to predict (e.g., "Acidity")
5. Click **Create** and training starts immediately in the background
***
## Step 8: Run an experiment (CoPilot mode)
CoPilot automatically finds the best model for your data.
1. Go to **Experiments** in the sidebar
2. Click **New Experiment**
3. Select **CoPilot** mode
4. Choose your dataset and the **target property** you want to predict (e.g., "Acidity")
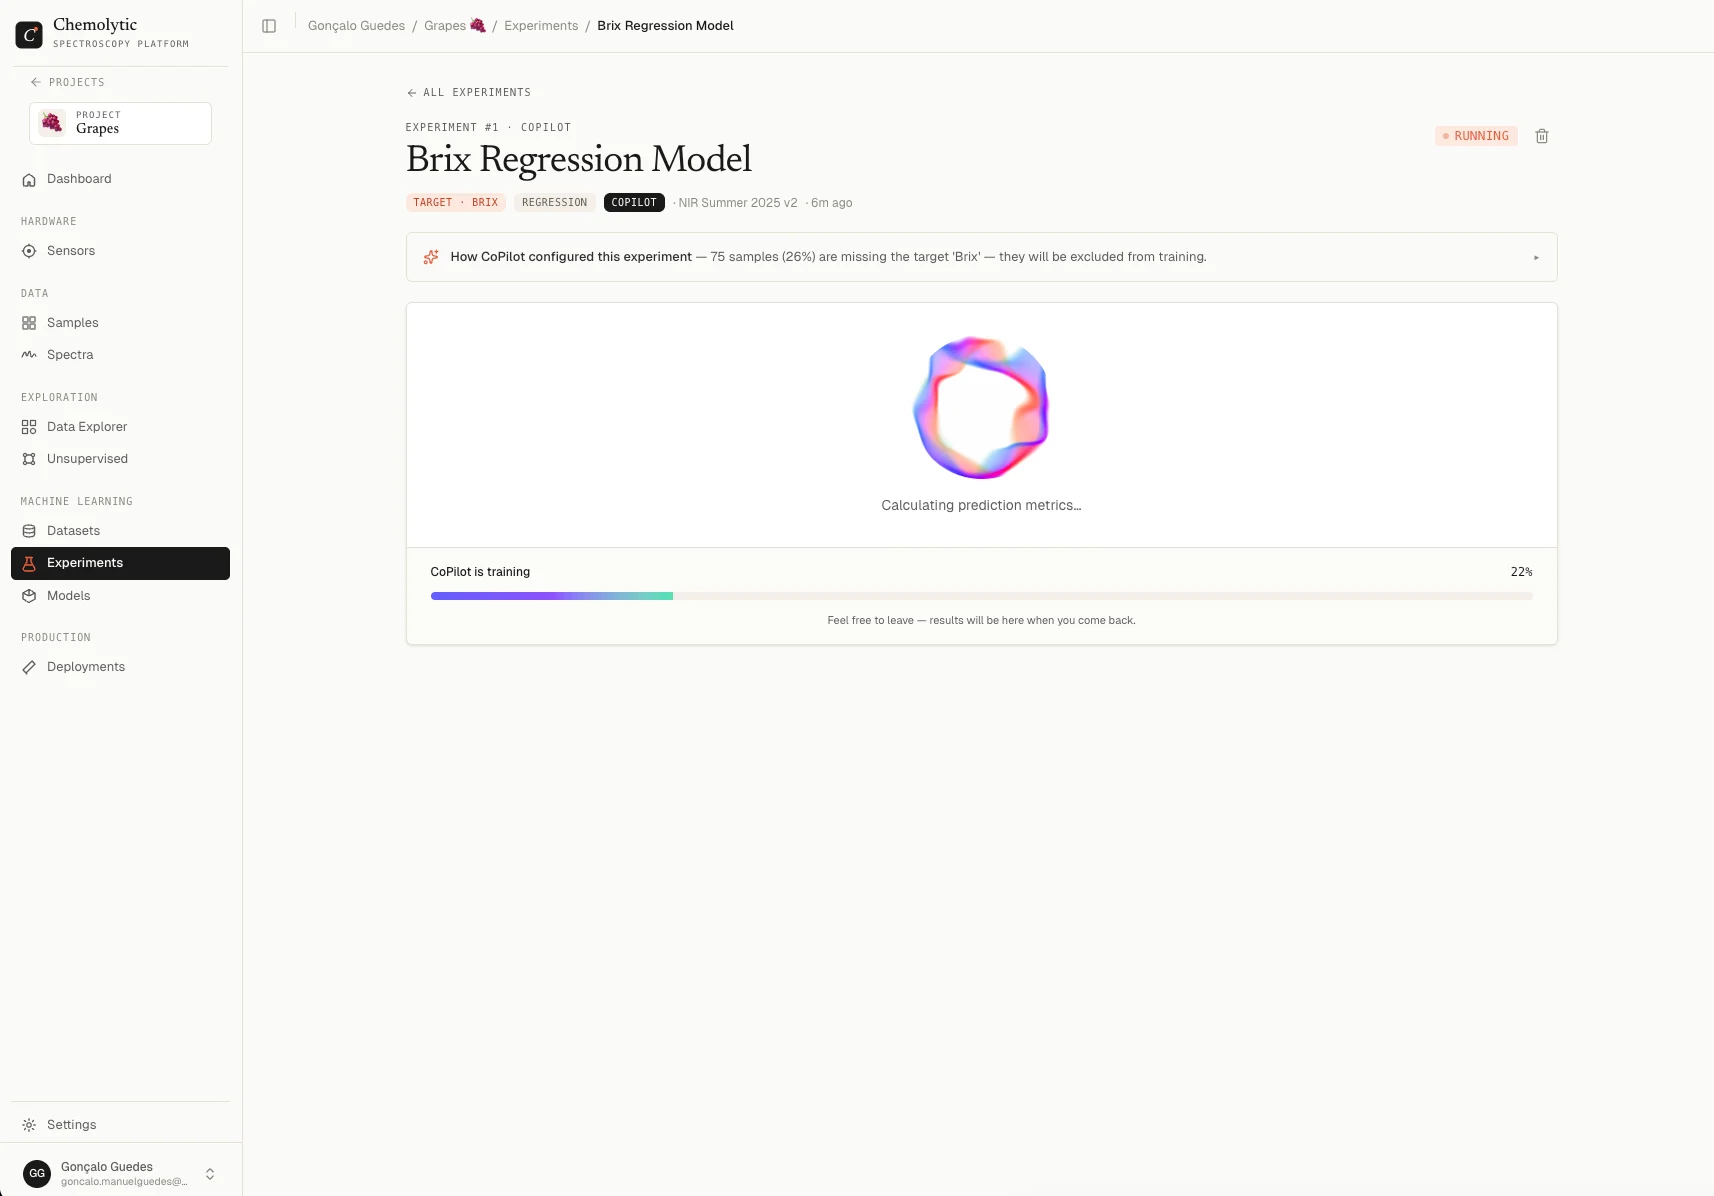
5. Click **Create** and training starts immediately in the background
 6. Wait for the experiment to complete. You'll see a progress indicator and trials appearing in real time
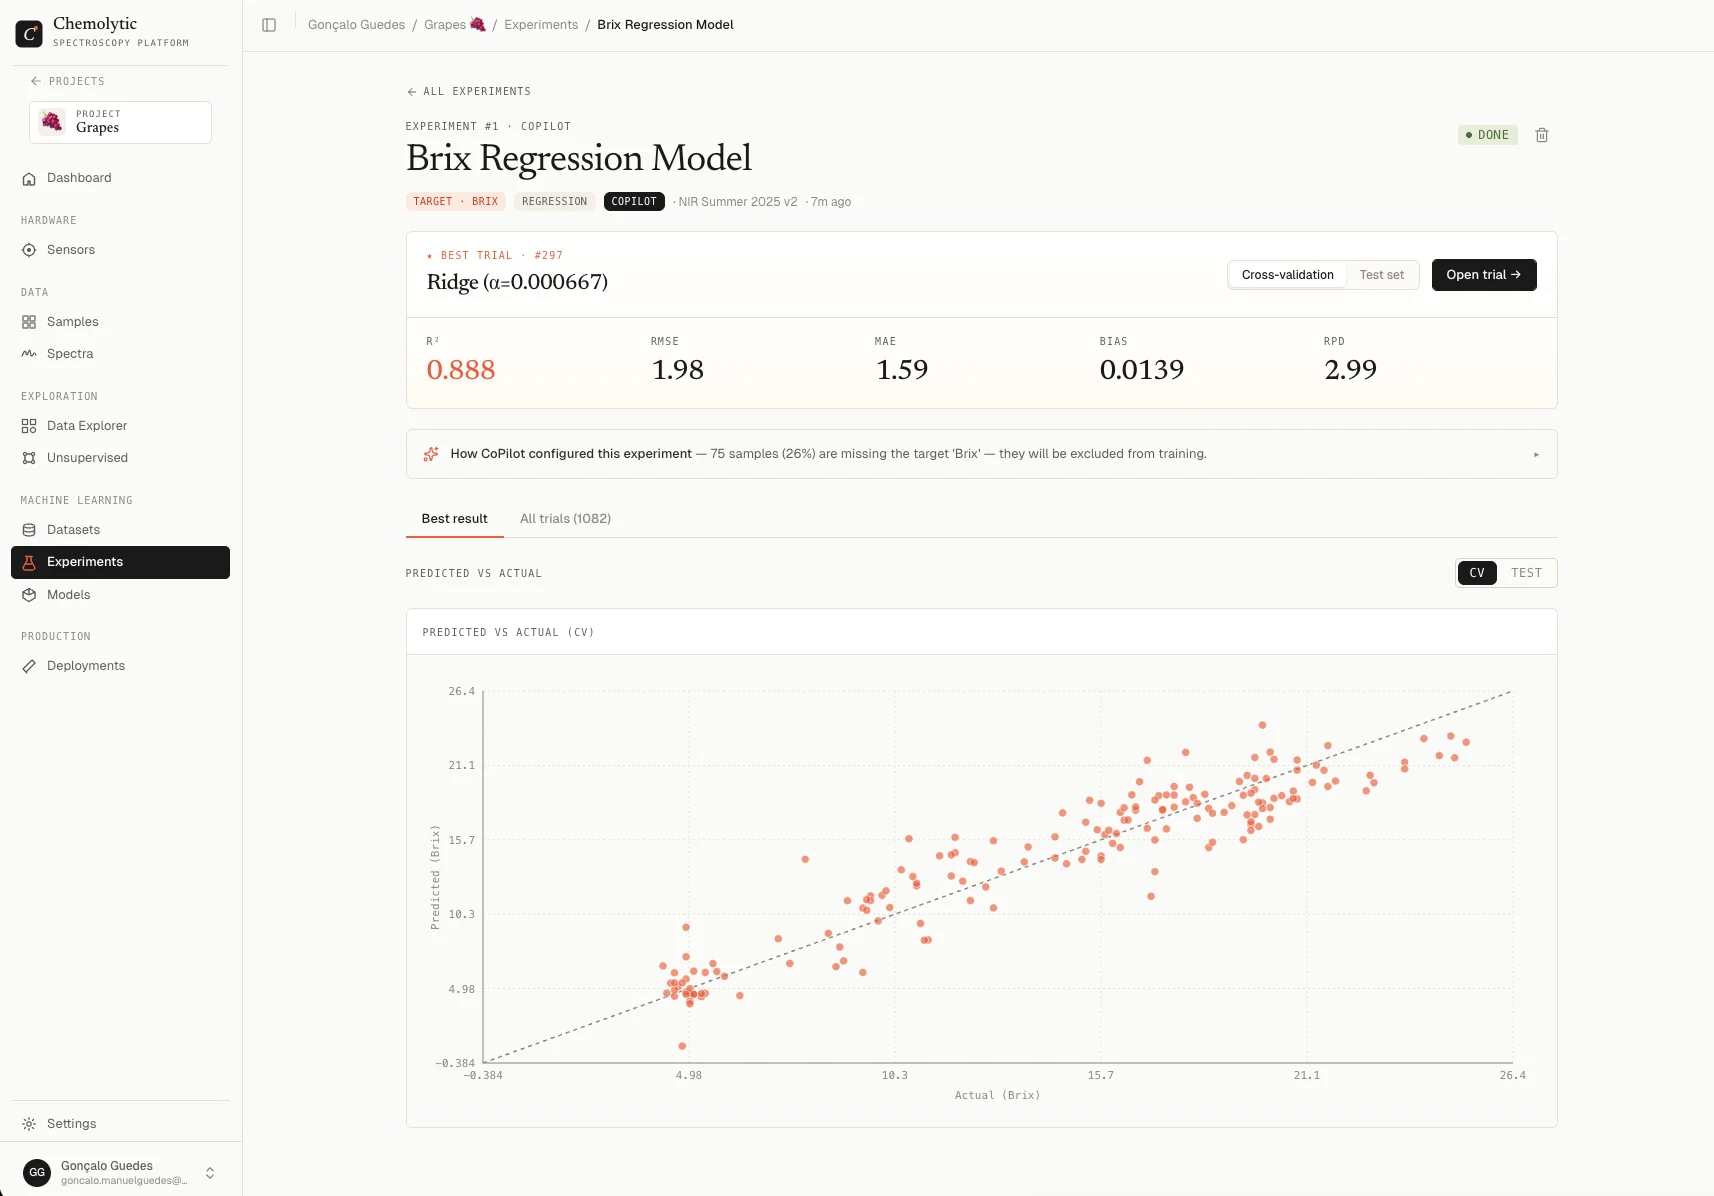
 7. When done, review the **best model** and its metrics (R², RMSE, etc.)
 ***
## Step 9: Register and deploy the model
1. From the experiment results, click **Register Model** on the best trial
2. Go to **Models** in the sidebar and your model appears there
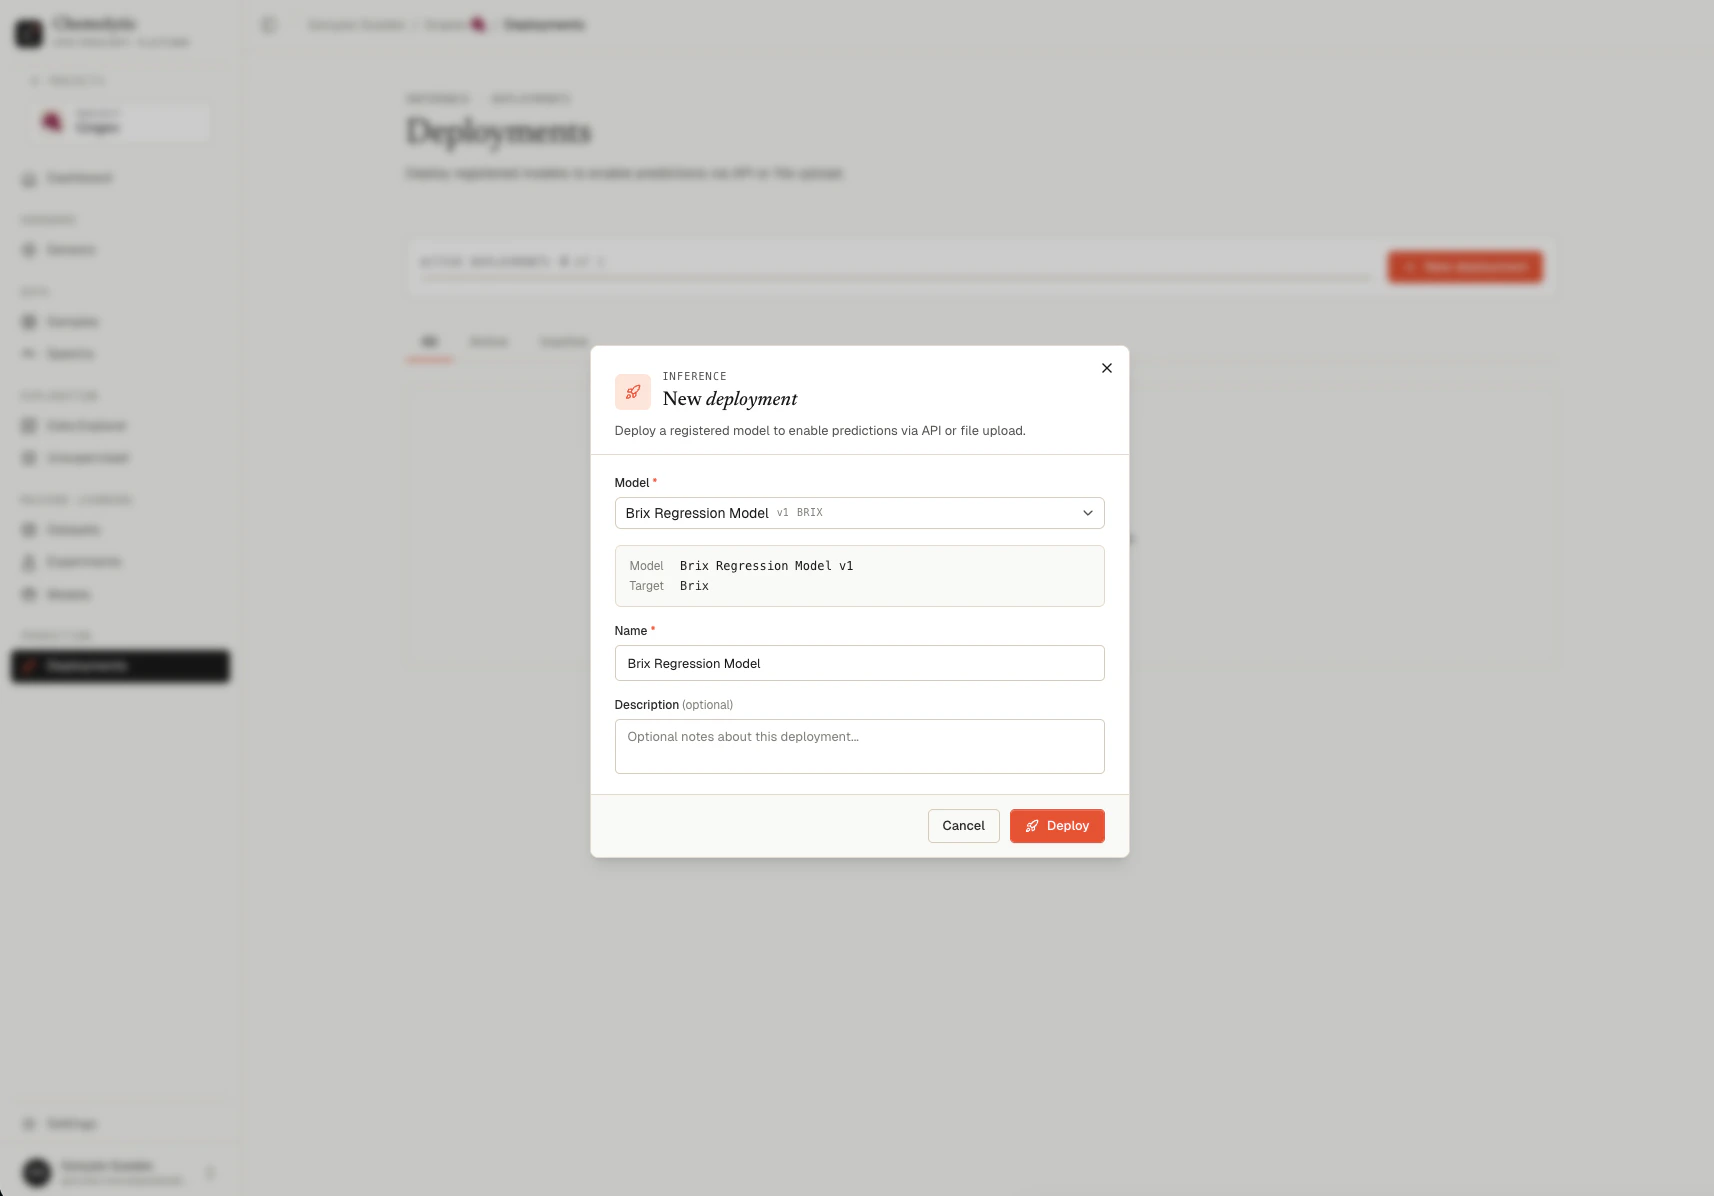
3. Go to **Deployments** and click **New Deployment**
4. Select your registered model and click **Deploy**
***
## Step 9: Register and deploy the model
1. From the experiment results, click **Register Model** on the best trial
2. Go to **Models** in the sidebar and your model appears there
3. Go to **Deployments** and click **New Deployment**
4. Select your registered model and click **Deploy**
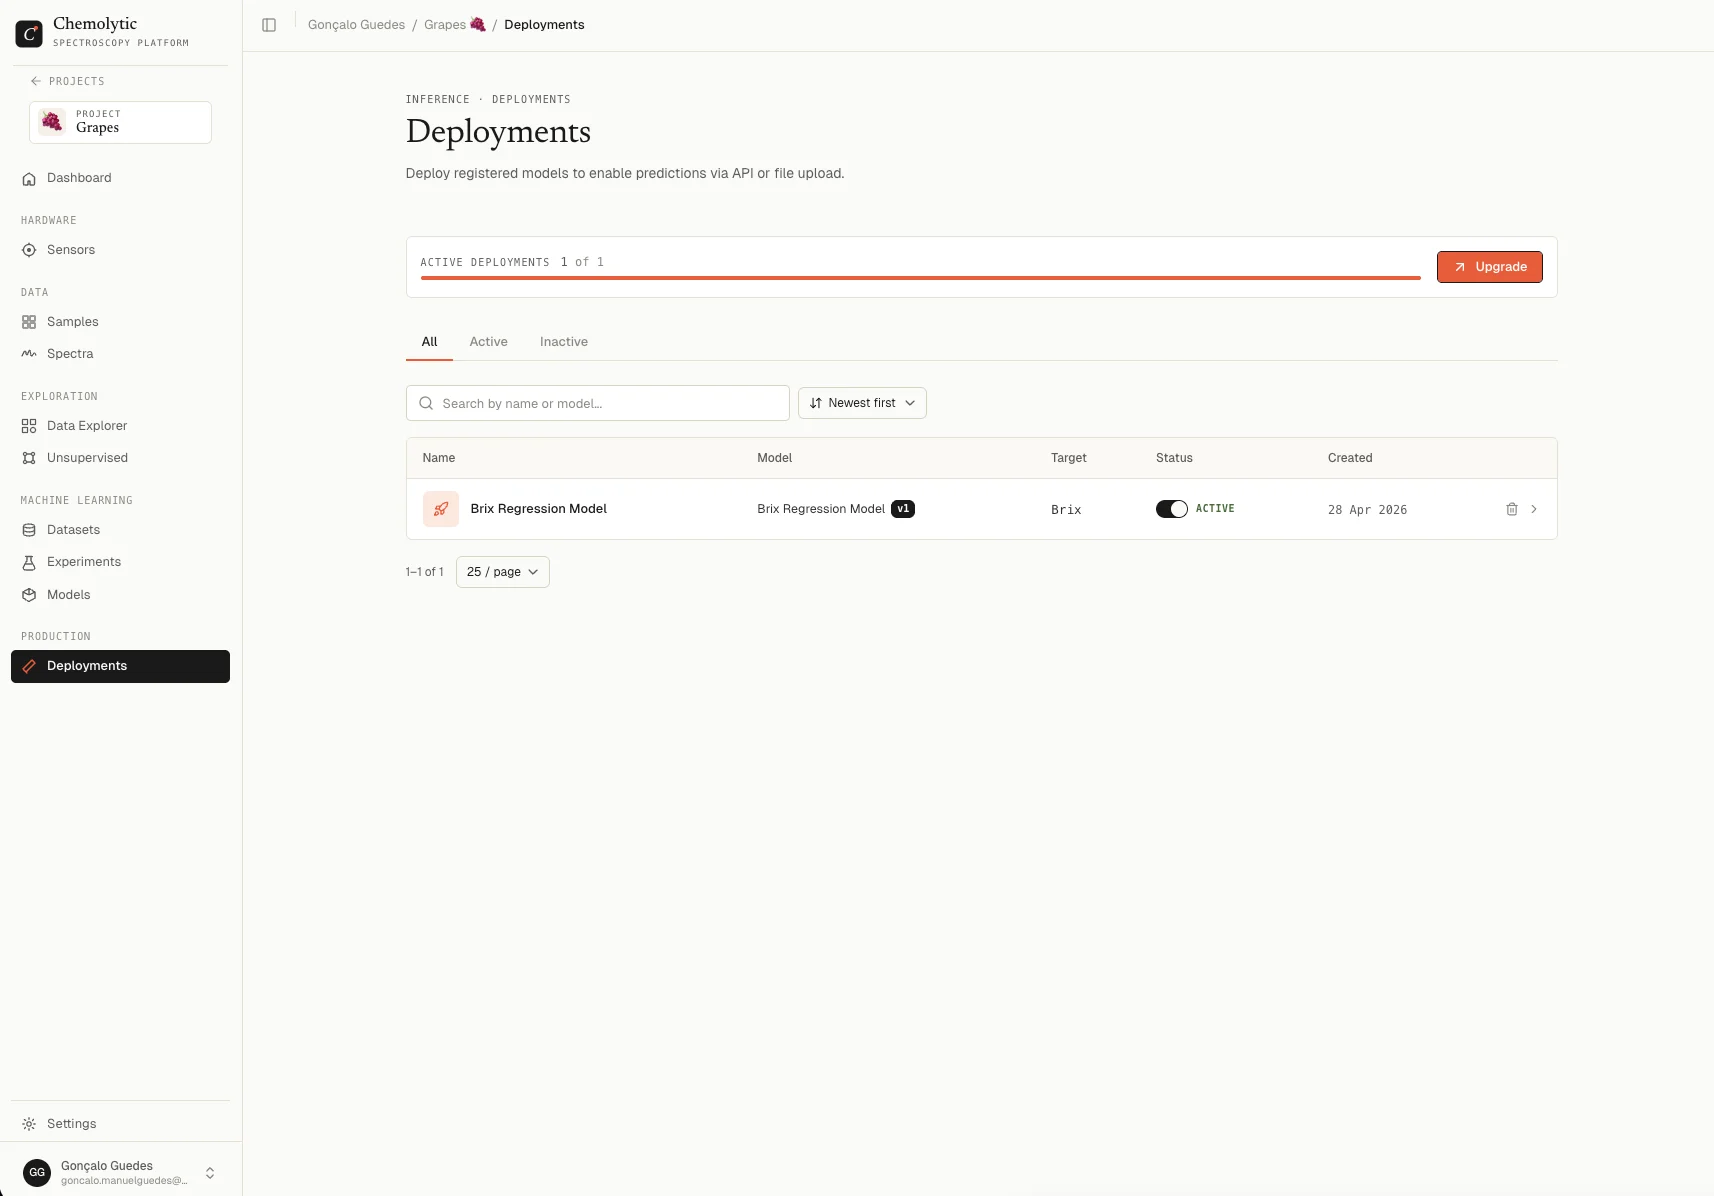
 Your model is now live.
 ***
## Step 10: Make predictions
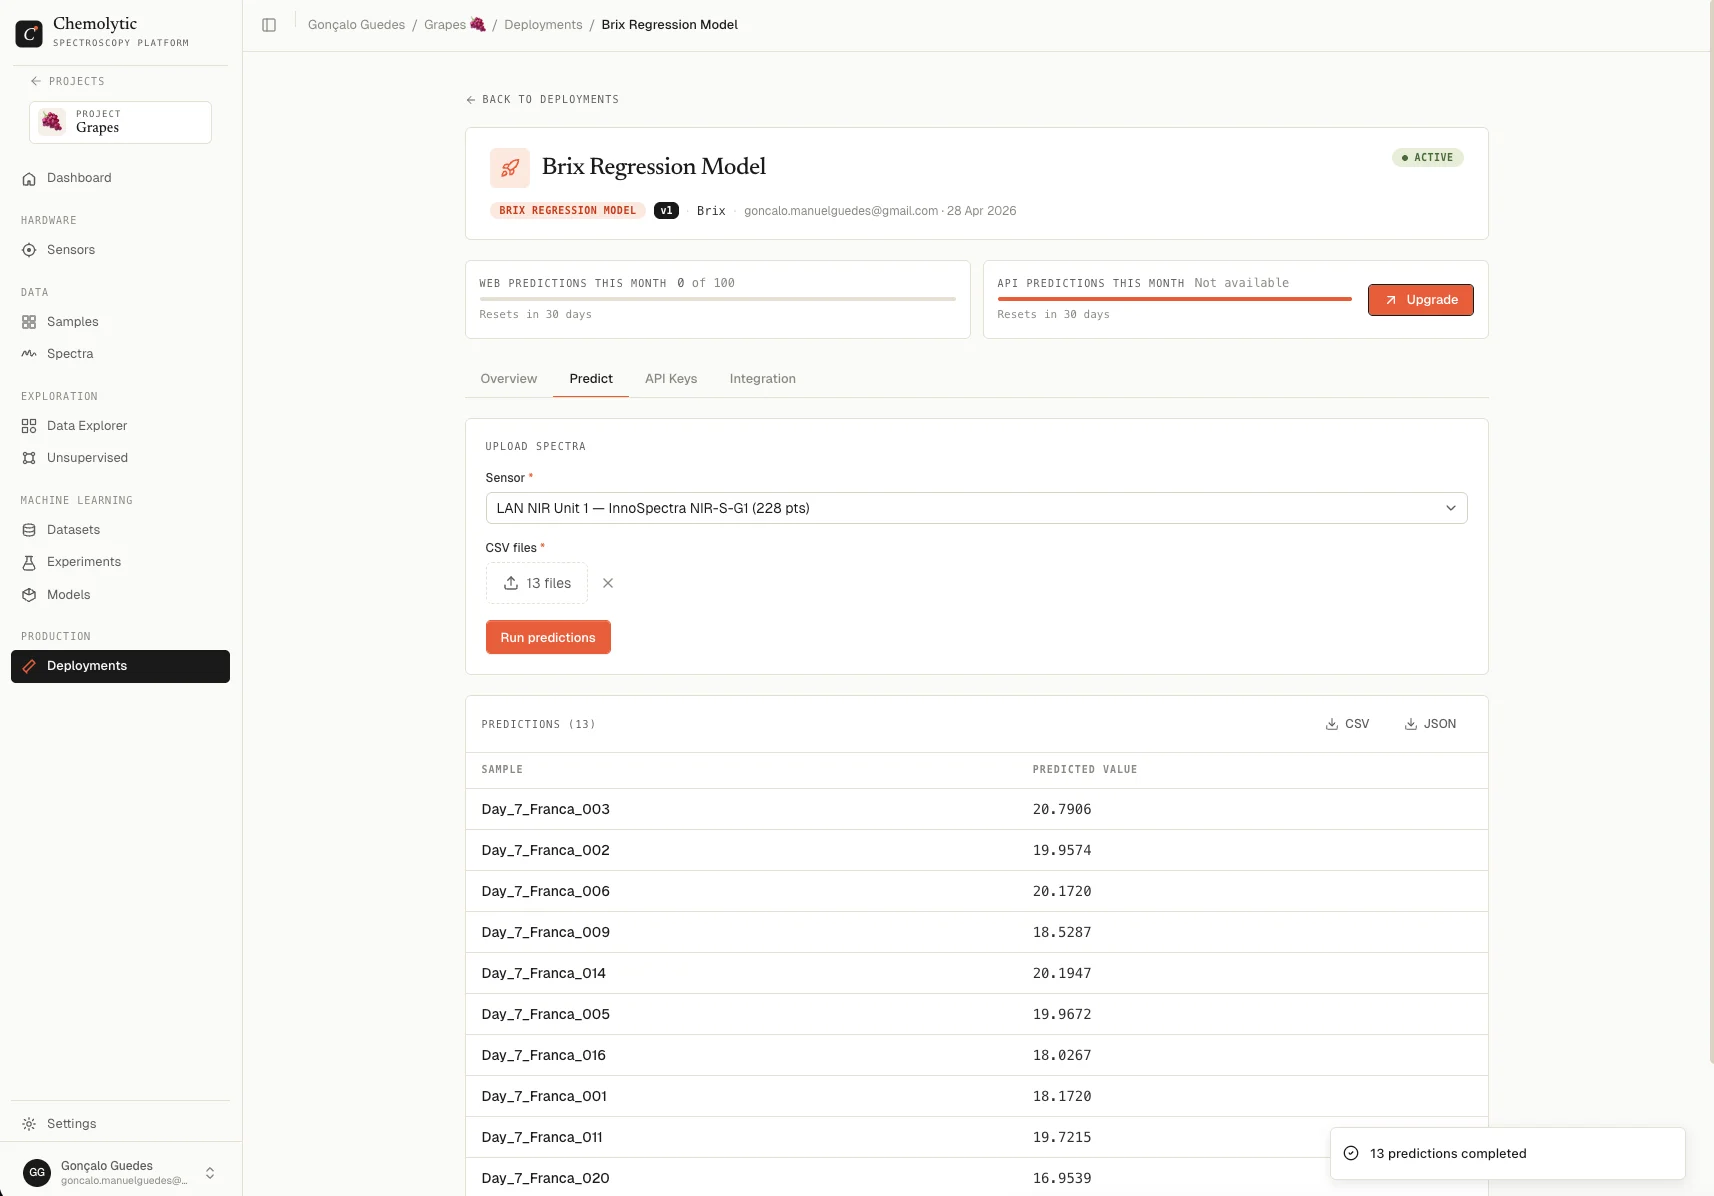
1. On the **Deployment detail** page, upload a new spectra CSV
2. See predictions instantly. The results table shows predicted values for each spectrum
***
## Step 10: Make predictions
1. On the **Deployment detail** page, upload a new spectra CSV
2. See predictions instantly. The results table shows predicted values for each spectrum
 You've gone from raw spectra to live predictions. Everything from here is about refining the process: better samples, better preprocessing, better models.
***
## What's next?
Learn what sensors, samples, datasets, and preprocessing mean.
Run PCA or t-SNE before modelling to find outliers and patterns.
Configure preprocessing and models manually for full control.
Add colleagues and collaborate on projects together.
You've gone from raw spectra to live predictions. Everything from here is about refining the process: better samples, better preprocessing, better models.
***
## What's next?
Learn what sensors, samples, datasets, and preprocessing mean.
Run PCA or t-SNE before modelling to find outliers and patterns.
Configure preprocessing and models manually for full control.
Add colleagues and collaborate on projects together.