> ## Documentation Index
> Fetch the complete documentation index at: https://docs.chemolytic.com/llms.txt
> Use this file to discover all available pages before exploring further.
# Trial results
> Read trial metrics, charts, and pipelines, then register the trial as a deployable model.
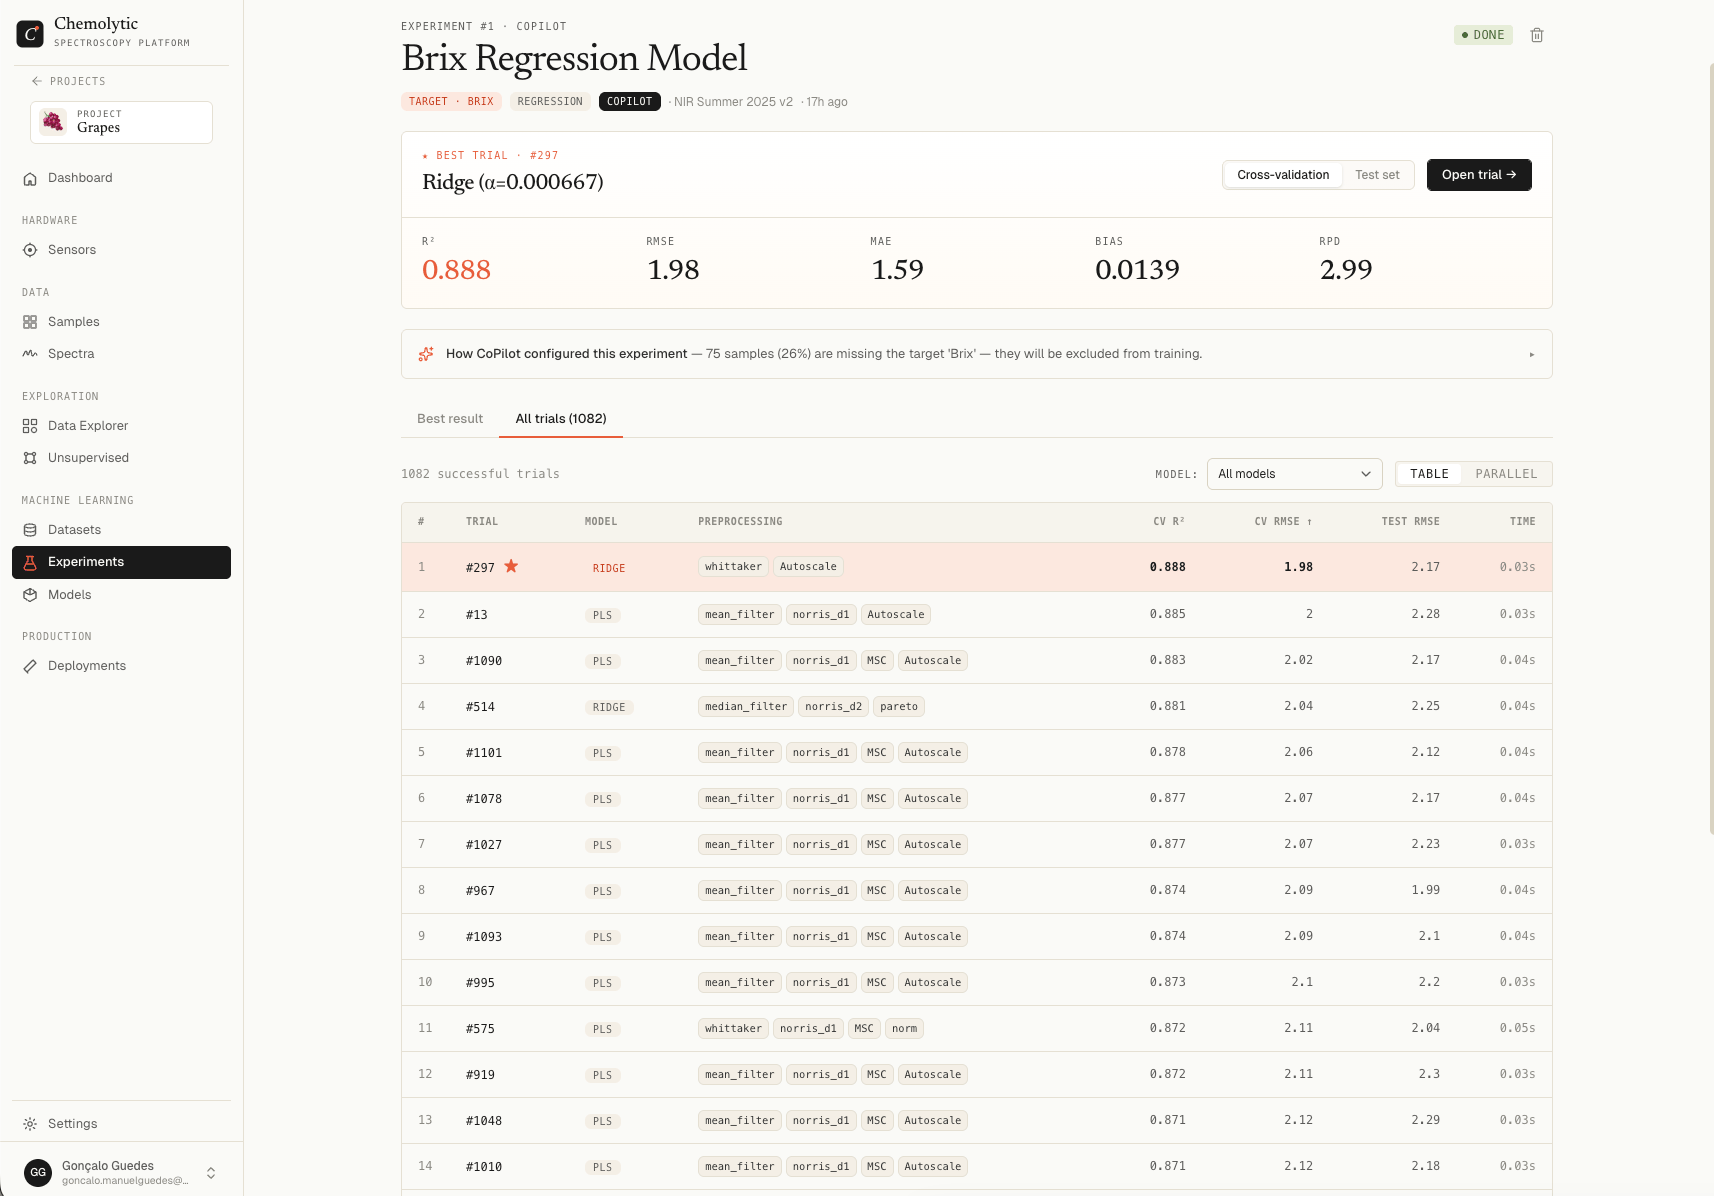
A trial is a single trained model. Click any trial row in the leaderboard to open its detail modal.
 ## Tabs in the trial modal
| Tab | Contents |
| ----------- | -------------------------------------------------- |
| **Results** | Pipeline, metrics, charts |
| **Details** | Trial number, duration, exact hyperparameters used |
## The Results tab
### Pipeline section
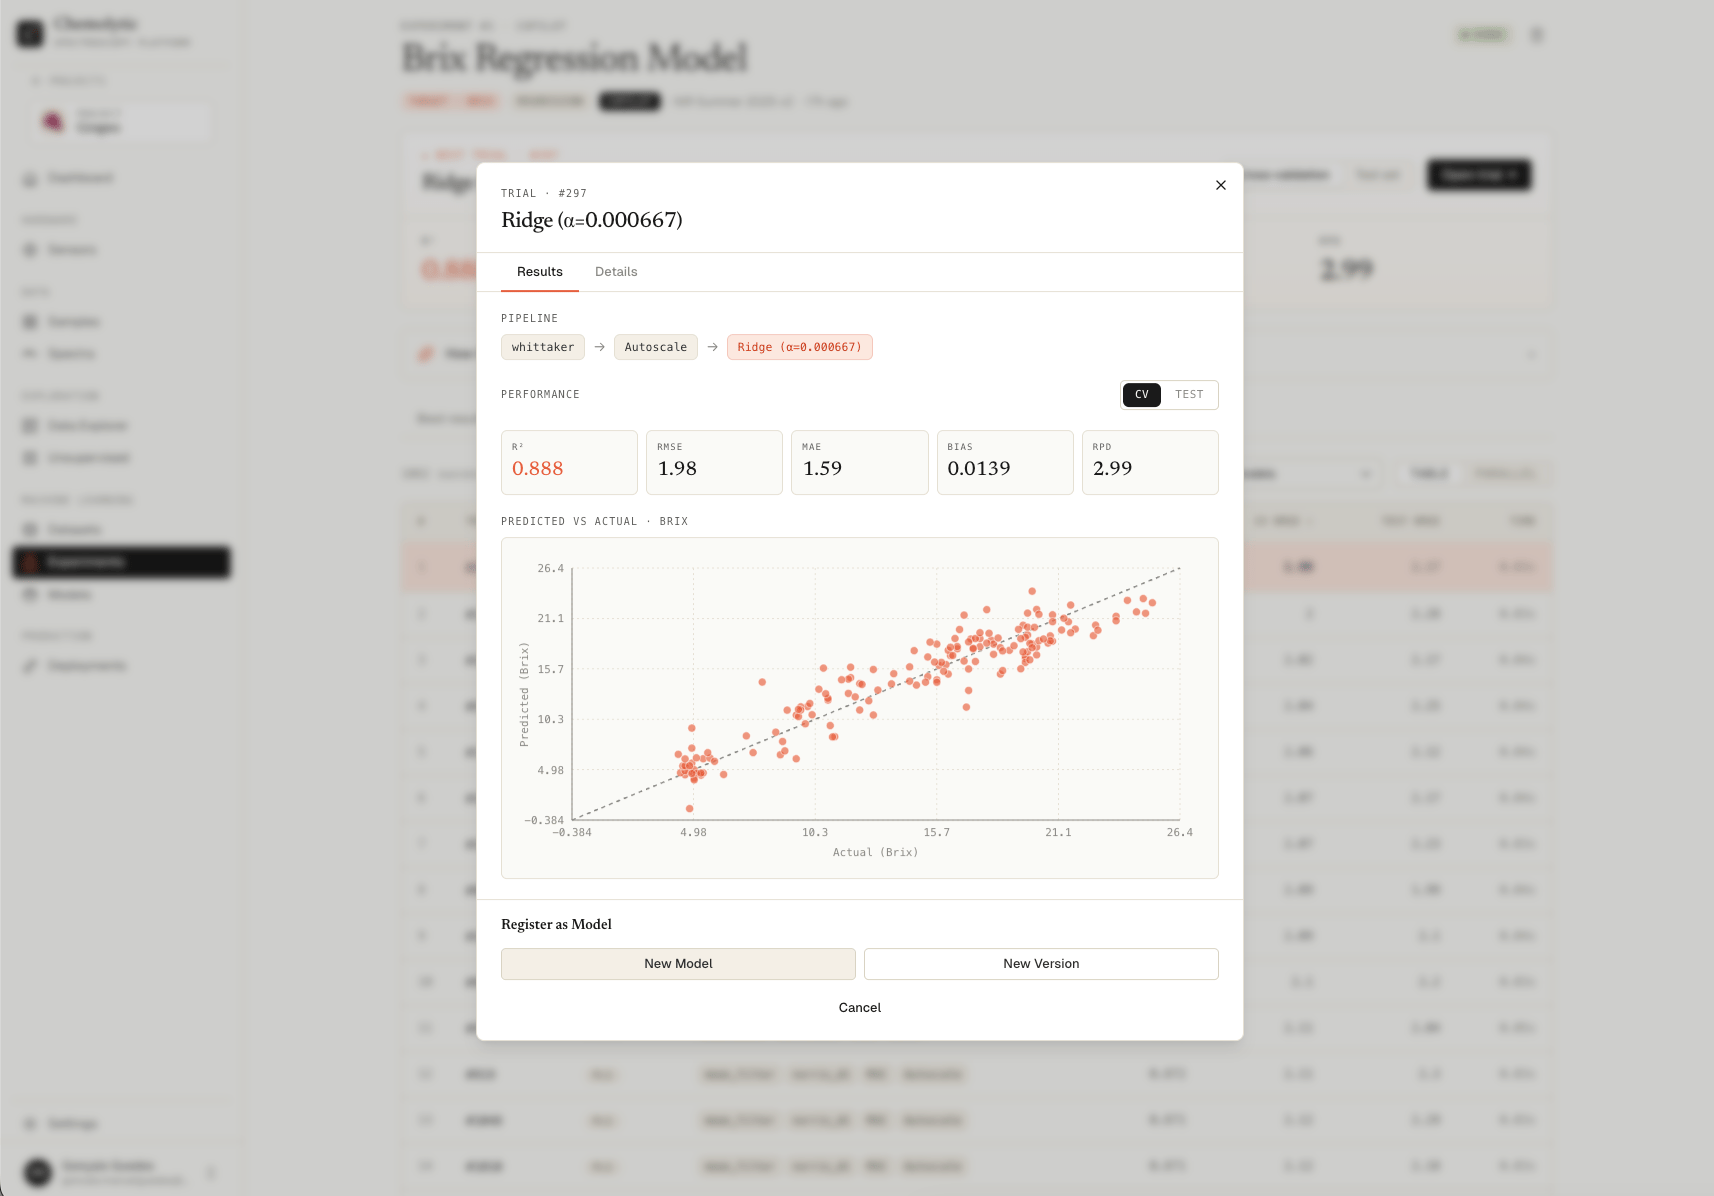
Visual representation of what was trained:
```
[ SNV ] → [ SG D1 (w=21, p=2) ] → [ Mean Center ] → [ PLS (n=8) ]
```
Each preprocessing step is shown in a grey box, the model in a flame box. The arrows indicate execution order.
### Performance toggle: CV vs Test
The metric grid below the pipeline switches between two evaluations:
| Toggle | What it computes |
| -------- | ----------------------------------------------------------------------------------------------------- |
| **CV** | Average across cross-validation folds. Best estimate of how the model generalizes. |
| **Test** | Performance on a held-out test set never used in training. Confirms the CV result wasn't overfitting. |
Always check both. If CV looks great but Test is much worse, the model overfit. If both are similar, the model is solid.
### Regression metric grid
| Metric | Range | Better |
| -------- | --------- | --------------------------------------------- |
| **R²** | -∞ to 1.0 | Higher (closer to 1.0 = better fit) |
| **RMSE** | 0 to ∞ | Lower (in target units, e.g., °Bx) |
| **MAE** | 0 to ∞ | Lower (in target units) |
| **Bias** | -∞ to ∞ | Closer to 0 (systematic error) |
| **RPD** | 0 to ∞ | Higher (above 2 is useful, above 3 is strong) |
### Classification metric grid
| Metric | Range | Better |
| ----------------- | -------- | ------------------------------------------------- |
| **Accuracy** | 0 to 1.0 | Higher (fraction of correct predictions) |
| **F1 (macro)** | 0 to 1.0 | Higher (treats all classes equally) |
| **F1 (weighted)** | 0 to 1.0 | Higher (weighted by class size) |
| **Precision** | 0 to 1.0 | Higher (of predicted positives, fraction correct) |
| **Recall** | 0 to 1.0 | Higher (of actual positives, fraction caught) |
### Predicted vs Actual (regression)
Scatter plot with one point per sample.
* The **diagonal line** is the ideal: predicted value equals actual value
* Points close to the line = good predictions
* Points far from the line = errors
* A wide cloud = high noise; a tight diagonal cloud = strong model
Look for systematic patterns. If predictions are consistently low at high actual values, the model has a calibration issue at the high end. Add more samples in that range or try different preprocessing.
### Confusion matrix (classification)
Table where rows are actual classes and columns are predicted classes. Cell colour indicates count (darker = more predictions).
| Pattern | Meaning |
| -------------------------- | --------------------------------- |
| Diagonal dominant | Model is correct most of the time |
| Off-diagonal in one column | Model over-predicts that class |
| Off-diagonal in one row | Model misses that class often |
## The Details tab
Shows the exact configuration used:
* **Trial #** and **Duration** (training time in seconds)
* **Model parameters** with each hyperparameter value
* **Preprocessing parameters** for any step that has them
Use this to reproduce the trial in Scientist mode if you want to iterate on it.
## Comparing trials in the leaderboard
Before drilling into one trial, you usually want to compare many. The **All trials** tab on the experiment detail page shows every trial across every job, with two view modes.
### Table view
A standard sortable table with one row per trial.
| Column | Description |
| ----------------- | ------------------------------------------------------------------------------------------ |
| **#** | Trial number |
| **Model** | Algorithm (PLS, Ridge, RF, etc.) |
| **Preprocessing** | Each step in order, shown as small boxes |
| **Model params** | Visible numeric hyperparameters (e.g., n\_components, alpha) |
| **Secondary CV** | Secondary CV metric (e.g., R² for regression) |
| **Primary CV** | Primary CV metric used to pick the best (RMSE for regression, F1 macro for classification) |
| **Test** | Held-out test set metric |
| **Time** | Training duration in seconds |
The **best trial** is highlighted with a flame-coloured row and a star (★).
Click any column header to sort. Click a row to open the trial detail modal.
#### Filters and pagination
* **Model filter**: dropdown to limit the table to one model family (e.g., only PLS trials). Useful when you have hundreds of trials across many models.
* **Page size**: 25, 50, 100, or 250 per page.
* **Counter**: shows "X-Y of Z" with a "(filtered)" suffix when the model filter is active.
### Parallel coordinates view
Toggle from **Table** to **Parallel** at the top right.
## Tabs in the trial modal
| Tab | Contents |
| ----------- | -------------------------------------------------- |
| **Results** | Pipeline, metrics, charts |
| **Details** | Trial number, duration, exact hyperparameters used |
## The Results tab
### Pipeline section
Visual representation of what was trained:
```
[ SNV ] → [ SG D1 (w=21, p=2) ] → [ Mean Center ] → [ PLS (n=8) ]
```
Each preprocessing step is shown in a grey box, the model in a flame box. The arrows indicate execution order.
### Performance toggle: CV vs Test
The metric grid below the pipeline switches between two evaluations:
| Toggle | What it computes |
| -------- | ----------------------------------------------------------------------------------------------------- |
| **CV** | Average across cross-validation folds. Best estimate of how the model generalizes. |
| **Test** | Performance on a held-out test set never used in training. Confirms the CV result wasn't overfitting. |
Always check both. If CV looks great but Test is much worse, the model overfit. If both are similar, the model is solid.
### Regression metric grid
| Metric | Range | Better |
| -------- | --------- | --------------------------------------------- |
| **R²** | -∞ to 1.0 | Higher (closer to 1.0 = better fit) |
| **RMSE** | 0 to ∞ | Lower (in target units, e.g., °Bx) |
| **MAE** | 0 to ∞ | Lower (in target units) |
| **Bias** | -∞ to ∞ | Closer to 0 (systematic error) |
| **RPD** | 0 to ∞ | Higher (above 2 is useful, above 3 is strong) |
### Classification metric grid
| Metric | Range | Better |
| ----------------- | -------- | ------------------------------------------------- |
| **Accuracy** | 0 to 1.0 | Higher (fraction of correct predictions) |
| **F1 (macro)** | 0 to 1.0 | Higher (treats all classes equally) |
| **F1 (weighted)** | 0 to 1.0 | Higher (weighted by class size) |
| **Precision** | 0 to 1.0 | Higher (of predicted positives, fraction correct) |
| **Recall** | 0 to 1.0 | Higher (of actual positives, fraction caught) |
### Predicted vs Actual (regression)
Scatter plot with one point per sample.
* The **diagonal line** is the ideal: predicted value equals actual value
* Points close to the line = good predictions
* Points far from the line = errors
* A wide cloud = high noise; a tight diagonal cloud = strong model
Look for systematic patterns. If predictions are consistently low at high actual values, the model has a calibration issue at the high end. Add more samples in that range or try different preprocessing.
### Confusion matrix (classification)
Table where rows are actual classes and columns are predicted classes. Cell colour indicates count (darker = more predictions).
| Pattern | Meaning |
| -------------------------- | --------------------------------- |
| Diagonal dominant | Model is correct most of the time |
| Off-diagonal in one column | Model over-predicts that class |
| Off-diagonal in one row | Model misses that class often |
## The Details tab
Shows the exact configuration used:
* **Trial #** and **Duration** (training time in seconds)
* **Model parameters** with each hyperparameter value
* **Preprocessing parameters** for any step that has them
Use this to reproduce the trial in Scientist mode if you want to iterate on it.
## Comparing trials in the leaderboard
Before drilling into one trial, you usually want to compare many. The **All trials** tab on the experiment detail page shows every trial across every job, with two view modes.
### Table view
A standard sortable table with one row per trial.
| Column | Description |
| ----------------- | ------------------------------------------------------------------------------------------ |
| **#** | Trial number |
| **Model** | Algorithm (PLS, Ridge, RF, etc.) |
| **Preprocessing** | Each step in order, shown as small boxes |
| **Model params** | Visible numeric hyperparameters (e.g., n\_components, alpha) |
| **Secondary CV** | Secondary CV metric (e.g., R² for regression) |
| **Primary CV** | Primary CV metric used to pick the best (RMSE for regression, F1 macro for classification) |
| **Test** | Held-out test set metric |
| **Time** | Training duration in seconds |
The **best trial** is highlighted with a flame-coloured row and a star (★).
Click any column header to sort. Click a row to open the trial detail modal.
#### Filters and pagination
* **Model filter**: dropdown to limit the table to one model family (e.g., only PLS trials). Useful when you have hundreds of trials across many models.
* **Page size**: 25, 50, 100, or 250 per page.
* **Counter**: shows "X-Y of Z" with a "(filtered)" suffix when the model filter is active.
### Parallel coordinates view
Toggle from **Table** to **Parallel** at the top right.
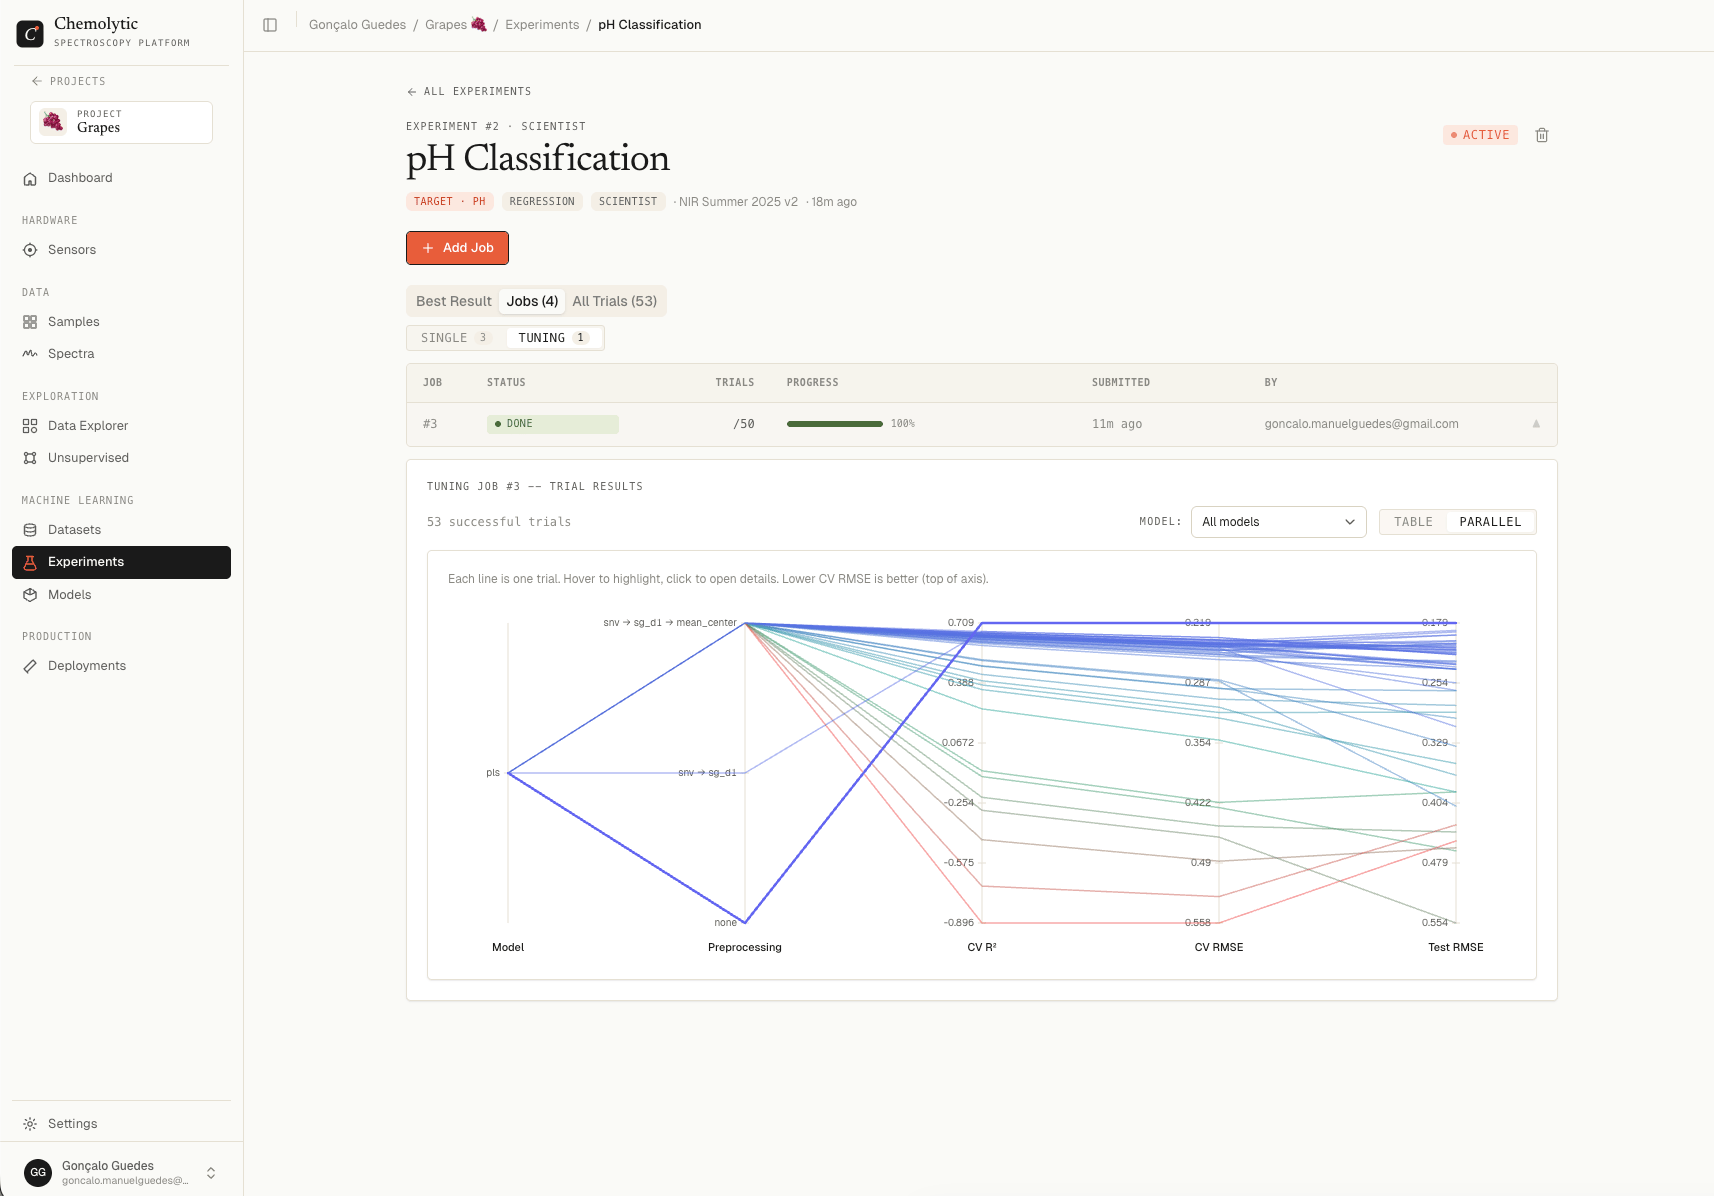 In parallel coordinates:
* Each **line** is one trial
* Each **vertical axis** is one parameter or metric (model family, preprocessing choice, hyperparameter values, CV metrics, test metrics)
* Lines move from left to right, connecting that trial's value on each axis
* Better metrics are oriented so "down" is always good (or "up", labelled at the top of each axis)
#### What this view is good for
| Goal | How parallel coordinates helps |
| ----------------------------------------------------- | ------------------------------------------------------------- |
| Spot which preprocessing dominates the top trials | Bands of lines clustering at the same preprocessing values |
| Find correlations between hyperparameters and metrics | Lines bending the same way across two axes |
| Identify trial outliers (great metric, weird config) | A single line that goes far from the main cluster |
| See if a model family is consistently better | Lines starting at the same model that all reach a good metric |
#### Interaction
* **Hover** any line to highlight it; other lines fade
* **Click** a line to open the trial detail modal
* The legend at the top of each axis tells you whether higher or lower is better
Switch to parallel coordinates after a tuning job with 50+ trials. You'll see at a glance whether the search converged on a region of the parameter space, or whether top trials are scattered (suggesting more search is needed or the problem is hard).
### Per-job leaderboards (Scientist mode)
Inside the **Jobs** tab, clicking an expanded tuning job row reveals the leaderboard for **just that job's trials**. Same table and parallel views, scoped to a single job. Useful when you've run multiple tuning jobs with different parameter spaces and want to evaluate them independently.
## Registering a model
Click **Register Model** at the bottom of the modal. A footer panel opens.
In parallel coordinates:
* Each **line** is one trial
* Each **vertical axis** is one parameter or metric (model family, preprocessing choice, hyperparameter values, CV metrics, test metrics)
* Lines move from left to right, connecting that trial's value on each axis
* Better metrics are oriented so "down" is always good (or "up", labelled at the top of each axis)
#### What this view is good for
| Goal | How parallel coordinates helps |
| ----------------------------------------------------- | ------------------------------------------------------------- |
| Spot which preprocessing dominates the top trials | Bands of lines clustering at the same preprocessing values |
| Find correlations between hyperparameters and metrics | Lines bending the same way across two axes |
| Identify trial outliers (great metric, weird config) | A single line that goes far from the main cluster |
| See if a model family is consistently better | Lines starting at the same model that all reach a good metric |
#### Interaction
* **Hover** any line to highlight it; other lines fade
* **Click** a line to open the trial detail modal
* The legend at the top of each axis tells you whether higher or lower is better
Switch to parallel coordinates after a tuning job with 50+ trials. You'll see at a glance whether the search converged on a region of the parameter space, or whether top trials are scattered (suggesting more search is needed or the problem is hard).
### Per-job leaderboards (Scientist mode)
Inside the **Jobs** tab, clicking an expanded tuning job row reveals the leaderboard for **just that job's trials**. Same table and parallel views, scoped to a single job. Useful when you've run multiple tuning jobs with different parameter spaces and want to evaluate them independently.
## Registering a model
Click **Register Model** at the bottom of the modal. A footer panel opens.
 ### New model vs new version
You're given two options:
| Option | When to use |
| --------------- | ---------------------------------------------------------------------------------------------------------- |
| **New Model** | First time registering a model for this prediction problem |
| **New Version** | You already have a model and want to add a new version trained on more data or with better hyperparameters |
#### New model
| Field | Required | Notes |
| --------------- | -------- | -------------------------------------------------- |
| **Model name** | Yes | Defaults to the experiment name; you can change it |
| **Description** | No | Free-text |
Click **Register**. The trial is refit on the **full training set** (no CV split) and saved as v1 of the new model.
#### New version
| Field | Required | Notes |
| ------------------ | -------- | -------------------------------------------------------- |
| **Existing model** | Yes | Pick from a dropdown of registered models in the project |
| **What changed?** | No | Free-text. Use it to record why this version is better |
A confirmation step appears: "This will create a new version of '{name}' using trial #{number}. The model will be refit on the full training set."
Click **Create Version**. The trial is refit on the full training data and saved as the next version (v2, v3, ...).
## What happens after registration
The trial is permanently saved as a registered model. From there you can:
* View it in the [Models](/production/models) page
* [Deploy it](/production/deployments) for live predictions
* Compare versions across the model's history
The original trial in the experiment remains unchanged. Registration is a one-way action: it copies the trial's pipeline and refits on the full data, leaving the experiment intact.
## Tips for choosing a trial
**Don't always pick the best CV metric.** A trial with slightly worse metrics but a simpler pipeline (fewer preprocessing steps, fewer components) often generalizes better in production.
**Test set agreement matters.** A trial where CV and Test metrics are very close is more trustworthy than one where Test is dramatically worse than CV.
**Look at the residual pattern, not just the number.** Two trials with the same RMSE can produce very different prediction behaviours. Always check the predicted vs actual chart.
### New model vs new version
You're given two options:
| Option | When to use |
| --------------- | ---------------------------------------------------------------------------------------------------------- |
| **New Model** | First time registering a model for this prediction problem |
| **New Version** | You already have a model and want to add a new version trained on more data or with better hyperparameters |
#### New model
| Field | Required | Notes |
| --------------- | -------- | -------------------------------------------------- |
| **Model name** | Yes | Defaults to the experiment name; you can change it |
| **Description** | No | Free-text |
Click **Register**. The trial is refit on the **full training set** (no CV split) and saved as v1 of the new model.
#### New version
| Field | Required | Notes |
| ------------------ | -------- | -------------------------------------------------------- |
| **Existing model** | Yes | Pick from a dropdown of registered models in the project |
| **What changed?** | No | Free-text. Use it to record why this version is better |
A confirmation step appears: "This will create a new version of '{name}' using trial #{number}. The model will be refit on the full training set."
Click **Create Version**. The trial is refit on the full training data and saved as the next version (v2, v3, ...).
## What happens after registration
The trial is permanently saved as a registered model. From there you can:
* View it in the [Models](/production/models) page
* [Deploy it](/production/deployments) for live predictions
* Compare versions across the model's history
The original trial in the experiment remains unchanged. Registration is a one-way action: it copies the trial's pipeline and refits on the full data, leaving the experiment intact.
## Tips for choosing a trial
**Don't always pick the best CV metric.** A trial with slightly worse metrics but a simpler pipeline (fewer preprocessing steps, fewer components) often generalizes better in production.
**Test set agreement matters.** A trial where CV and Test metrics are very close is more trustworthy than one where Test is dramatically worse than CV.
**Look at the residual pattern, not just the number.** Two trials with the same RMSE can produce very different prediction behaviours. Always check the predicted vs actual chart.