> ## Documentation Index
> Fetch the complete documentation index at: https://docs.chemolytic.com/llms.txt
> Use this file to discover all available pages before exploring further.
# Dataset detail
> Inspect everything captured in a dataset snapshot, and download it for offline use.
Click any dataset in the list to open its detail page.
 ## Header
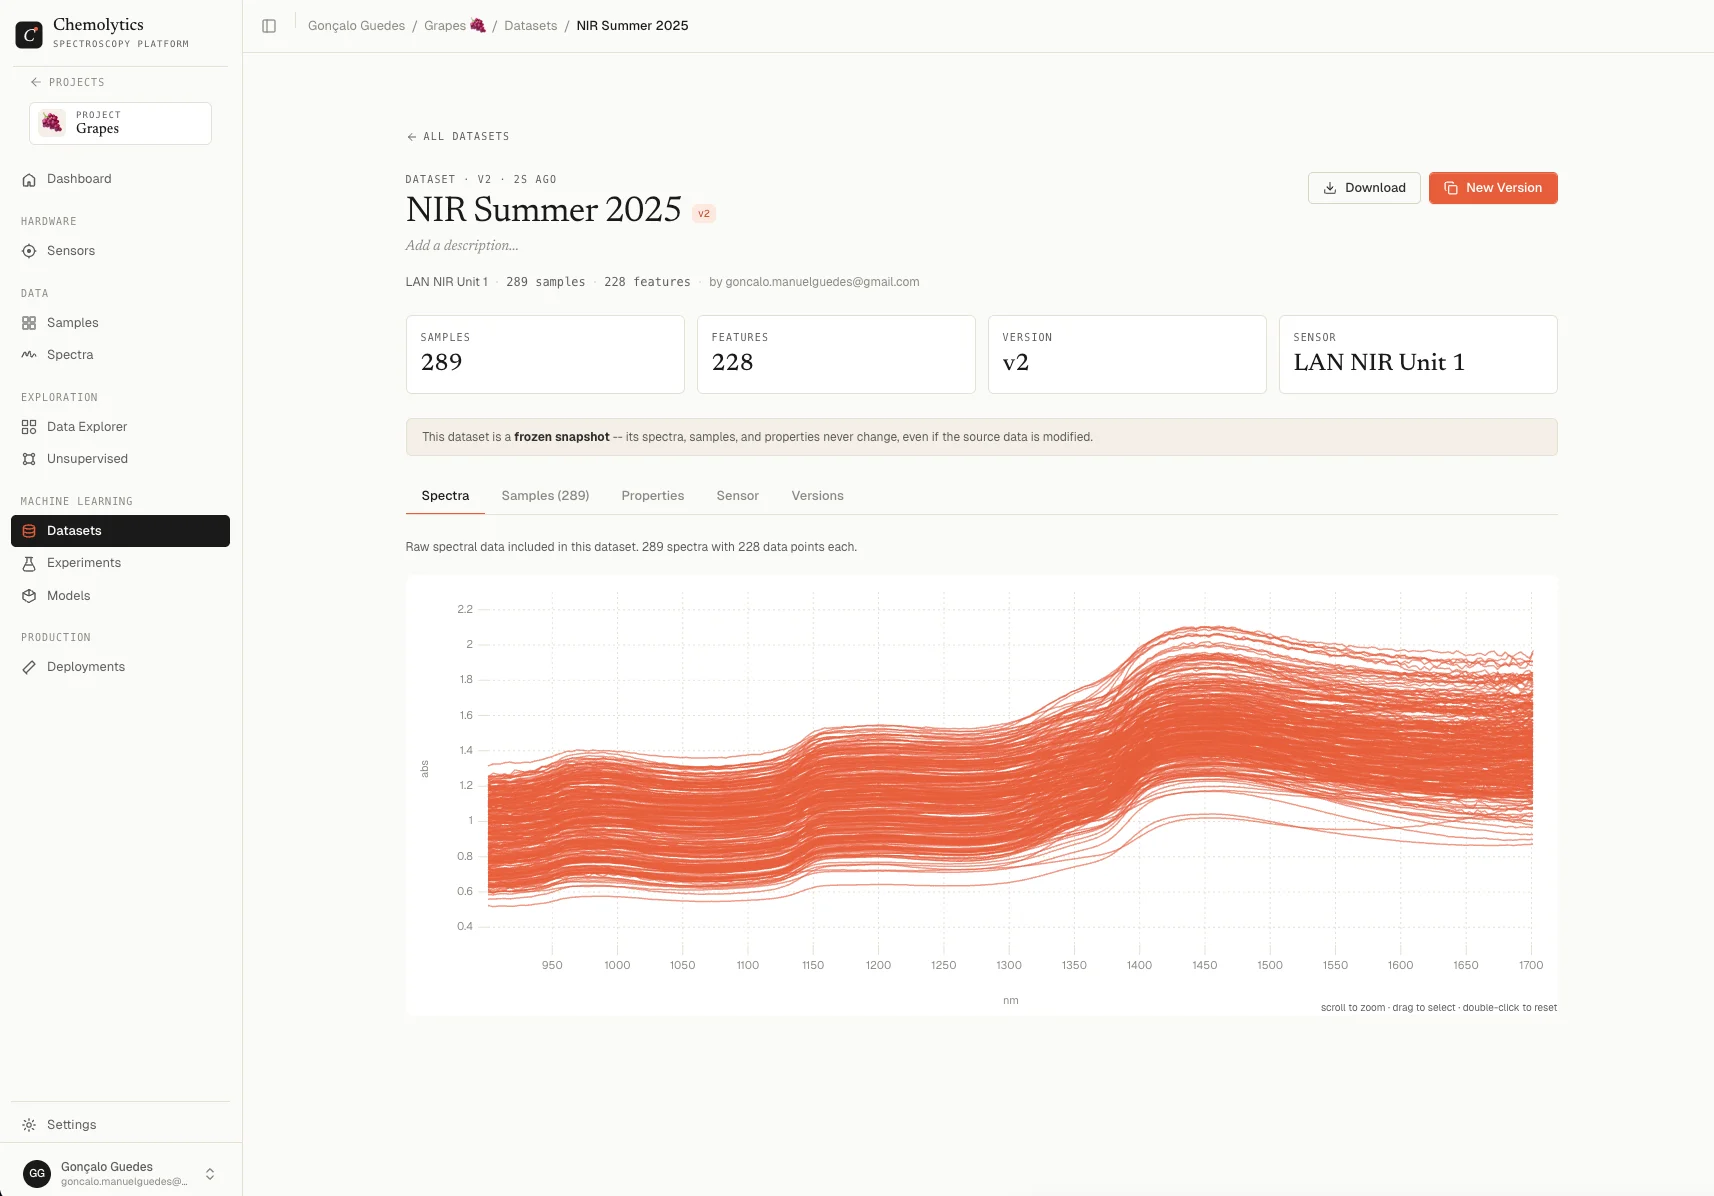
The header shows:
* The dataset **name** with a version badge (e.g., `v2`)
* An optional **description** (click the pencil icon to edit)
* Metric cards: **Samples**, **Features**, **Version**, and **Sensor**
The name and description are the **only fields you can edit** after creation. Everything else is frozen.
## Top-right actions
| Button | What it does |
| --------------- | -------------------------------------------------------------------------------- |
| **Download** | Opens a dropdown with **Download as JSON** or **Download as Excel** |
| **New Version** | Creates a new version of this dataset, capturing fresh data from the same sensor |
## Tabs
The detail page has five tabs.
### Spectra
Shows all spectra in the dataset overlaid on one chart, with the sensor's units on the axes.
This tab is useful for a quick visual sanity check: do the spectra look as expected? Are there any visible outliers in the snapshot?
### Samples
A searchable, paginated table of every sample in the snapshot, with columns for each property.
| Action | Result |
| ----------- | ------------------------------------------------------------------------------- |
| Click a row | Opens a modal showing that sample's spectrum, all property values, and metadata |
| Search | Filters by sample name |
| Page size | 25, 50, or 100 per page |
The values shown reflect the snapshot, not the current sample. If you edit the sample later, the dataset still shows the old value.
### Properties
Distribution statistics for every property in the snapshot. Same layout as the [Data Explorer](/explorer/data-explorer) Properties tab:
* Continuous: mean, median, std, min, Q1, Q3, max, plus histogram and box plot
* Categorical: bar chart of category counts
This is the snapshot's view: numbers reflect the dataset, not the current state of the project.
### Sensor
Metadata for the sensor used to create the dataset. Includes:
* Name and description
* Manufacturer and model
* Type (NIR, FTIR, etc.)
* Units (x and y)
* Number of data points
* X-axis range (min and max)
* Creation date and creator
* Any custom fields
This is a copy of the sensor at snapshot time. Even if you edit the sensor later, the dataset shows the original.
### Versions
A table of every version of this dataset, including the current one (highlighted).
| Column | Description |
| --------------- | ---------------------------------------------------------- |
| **Version** | Version number (v1, v2, ...) |
| **Description** | The "what changed?" note from when the version was created |
| **Samples** | Sample count at that version's snapshot time |
| **Features** | Feature count |
| **Created by** | User who created the version |
| **Created** | Timestamp |
Click any non-current row to navigate to that version's detail page. Click **New Version** to create another one.
## Downloads
Both download formats include the same data, packaged differently.
### Download as JSON
A single `.json` file containing:
* Dataset name, description, creation date
* Sensor metadata
* The full wavenumber/wavelength array
* Per-sample blocks: spectrum values, sample name, property values
* Property statistics
Useful for programmatic use (Python, R, custom scripts).
### Download as Excel
An `.xlsx` file with two sheets:
| Sheet | Contents |
| ------------ | -------------------------------------------------------------------------------------------------------------------------------------------------- |
| **Spectra** | Long table: each row is a sample. Columns: sample name, property values, then one column per wavenumber/wavelength point with the intensity value. |
| **Metadata** | Key-value pairs describing the dataset (name, description, sensor info, units, range, sample count, feature count, creator, creation date). |
Useful for inspection in Excel, sharing with collaborators who don't use Chemolytic, or pasting into other analysis tools.
Both formats include the original raw spectra and property values. They do not include any model artifacts or predictions. Use them as a portable backup of the snapshot.
## Header
The header shows:
* The dataset **name** with a version badge (e.g., `v2`)
* An optional **description** (click the pencil icon to edit)
* Metric cards: **Samples**, **Features**, **Version**, and **Sensor**
The name and description are the **only fields you can edit** after creation. Everything else is frozen.
## Top-right actions
| Button | What it does |
| --------------- | -------------------------------------------------------------------------------- |
| **Download** | Opens a dropdown with **Download as JSON** or **Download as Excel** |
| **New Version** | Creates a new version of this dataset, capturing fresh data from the same sensor |
## Tabs
The detail page has five tabs.
### Spectra
Shows all spectra in the dataset overlaid on one chart, with the sensor's units on the axes.
This tab is useful for a quick visual sanity check: do the spectra look as expected? Are there any visible outliers in the snapshot?
### Samples
A searchable, paginated table of every sample in the snapshot, with columns for each property.
| Action | Result |
| ----------- | ------------------------------------------------------------------------------- |
| Click a row | Opens a modal showing that sample's spectrum, all property values, and metadata |
| Search | Filters by sample name |
| Page size | 25, 50, or 100 per page |
The values shown reflect the snapshot, not the current sample. If you edit the sample later, the dataset still shows the old value.
### Properties
Distribution statistics for every property in the snapshot. Same layout as the [Data Explorer](/explorer/data-explorer) Properties tab:
* Continuous: mean, median, std, min, Q1, Q3, max, plus histogram and box plot
* Categorical: bar chart of category counts
This is the snapshot's view: numbers reflect the dataset, not the current state of the project.
### Sensor
Metadata for the sensor used to create the dataset. Includes:
* Name and description
* Manufacturer and model
* Type (NIR, FTIR, etc.)
* Units (x and y)
* Number of data points
* X-axis range (min and max)
* Creation date and creator
* Any custom fields
This is a copy of the sensor at snapshot time. Even if you edit the sensor later, the dataset shows the original.
### Versions
A table of every version of this dataset, including the current one (highlighted).
| Column | Description |
| --------------- | ---------------------------------------------------------- |
| **Version** | Version number (v1, v2, ...) |
| **Description** | The "what changed?" note from when the version was created |
| **Samples** | Sample count at that version's snapshot time |
| **Features** | Feature count |
| **Created by** | User who created the version |
| **Created** | Timestamp |
Click any non-current row to navigate to that version's detail page. Click **New Version** to create another one.
## Downloads
Both download formats include the same data, packaged differently.
### Download as JSON
A single `.json` file containing:
* Dataset name, description, creation date
* Sensor metadata
* The full wavenumber/wavelength array
* Per-sample blocks: spectrum values, sample name, property values
* Property statistics
Useful for programmatic use (Python, R, custom scripts).
### Download as Excel
An `.xlsx` file with two sheets:
| Sheet | Contents |
| ------------ | -------------------------------------------------------------------------------------------------------------------------------------------------- |
| **Spectra** | Long table: each row is a sample. Columns: sample name, property values, then one column per wavenumber/wavelength point with the intensity value. |
| **Metadata** | Key-value pairs describing the dataset (name, description, sensor info, units, range, sample count, feature count, creator, creation date). |
Useful for inspection in Excel, sharing with collaborators who don't use Chemolytic, or pasting into other analysis tools.
Both formats include the original raw spectra and property values. They do not include any model artifacts or predictions. Use them as a portable backup of the snapshot.