> ## Documentation Index
> Fetch the complete documentation index at: https://docs.chemolytic.com/llms.txt
> Use this file to discover all available pages before exploring further.
# Welcome to Chemolytic
> Spectroscopy modelling made simple. No coding, no PhD required.
Chemolytic is a web application that helps you build **predictive models from spectroscopy data**, even if you've never written a line of code or taken a chemometrics class.
Whether you're working with **NIR**, **FTIR**, **Raman**, **SWIR**, or **UV-Vis** spectra, Chemolytic guides you from raw data to a deployed prediction model in minutes.
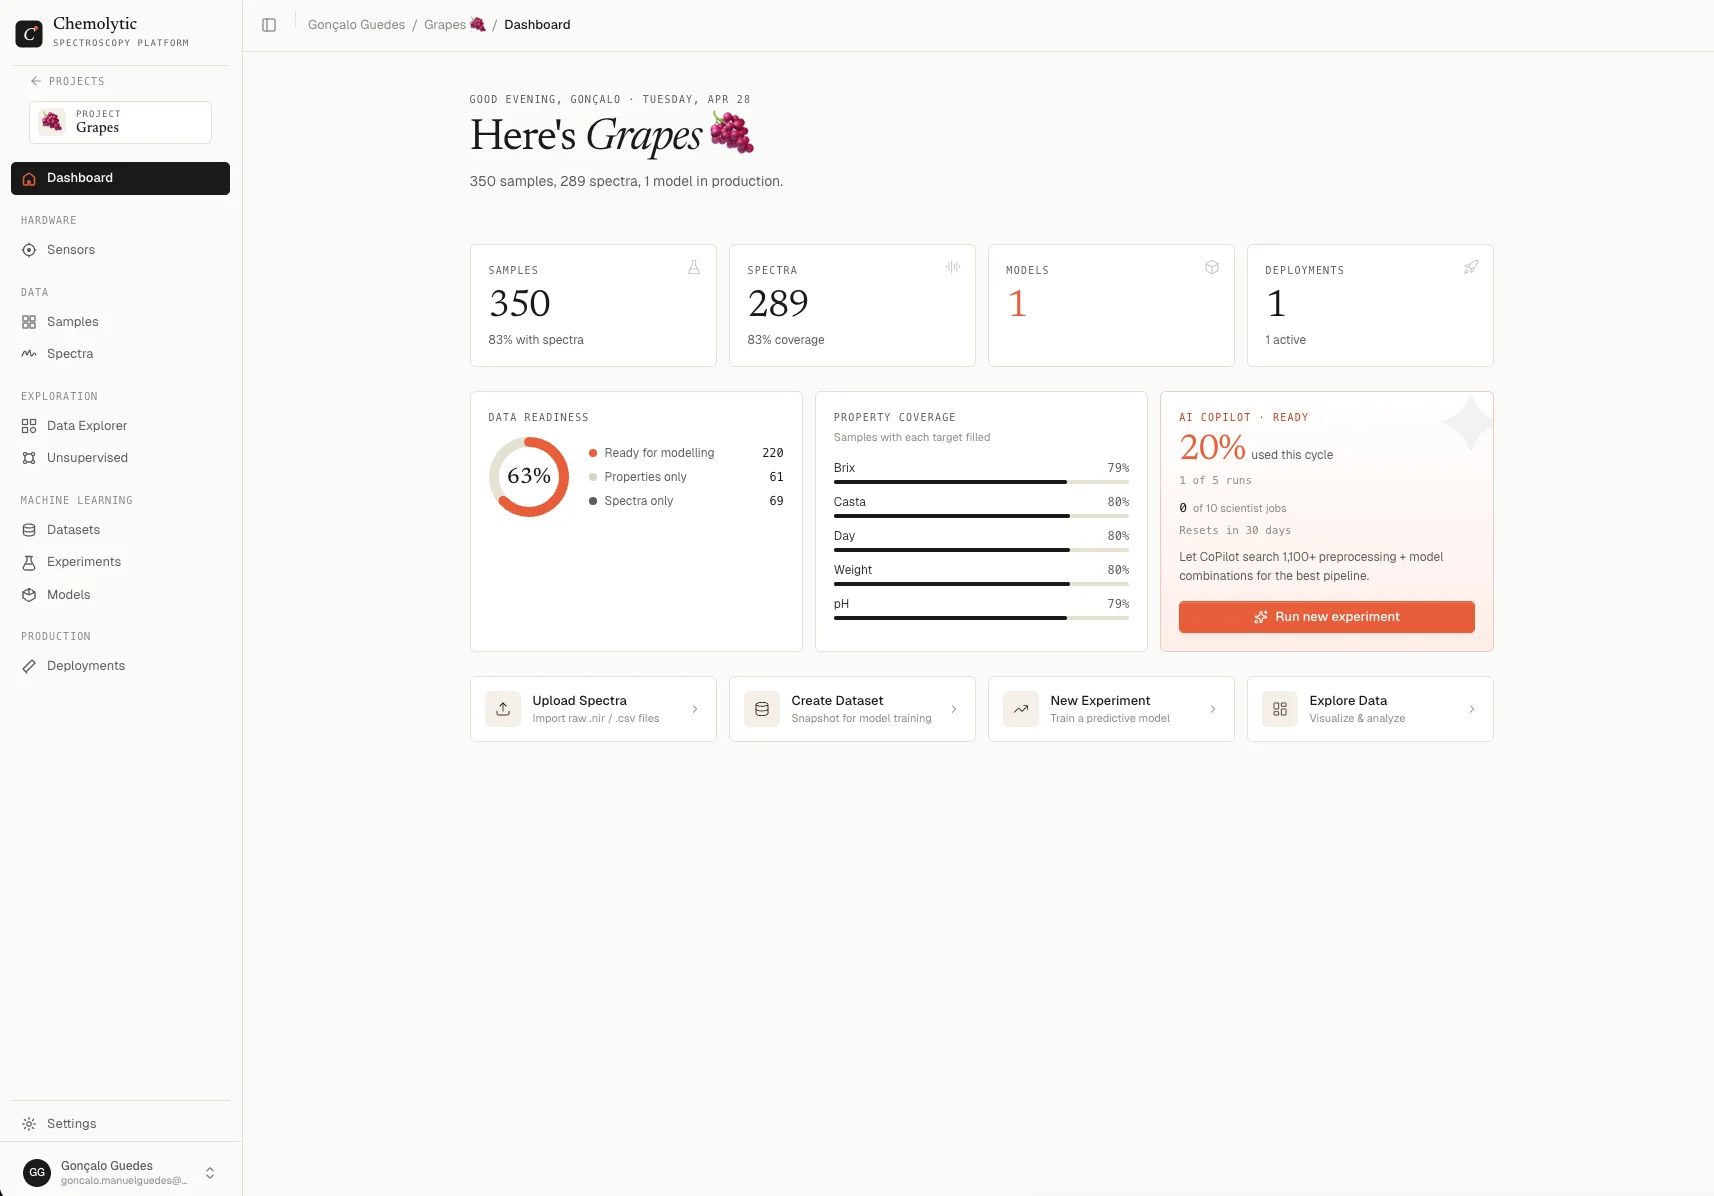 ## What can you do with Chemolytic?
Import spectroscopy data from CSV files, create samples, and define the properties you want to predict.
Visualize spectra, run PCA, t-SNE, or K-Means clustering to understand patterns before modelling.
Let CoPilot test 250+ preprocessing and model combinations, or configure everything manually in Scientist Mode.
Deploy your best model as an endpoint and get predictions on new spectra instantly.
## Who is this for?
* **Quality control teams** who need to predict properties (moisture, protein, fat) from spectra
* **Lab managers** who want to reduce wet chemistry costs
* **R\&D scientists** exploring spectral datasets for patterns
* **Process engineers** monitoring production lines with inline spectrometers
* **Students and researchers** learning chemometrics without needing to code
## How this documentation is organized
| Section | What you'll find |
| ------------------- | ------------------------------------------------------------------------------ |
| **Getting started** | Account setup, your first project, and key concepts |
| **Core concepts** | What sensors, samples, spectra, datasets, and preprocessing mean in Chemolytic |
| **Guides** | Step-by-step walkthroughs for every feature, with screenshots |
| **Team & billing** | Managing your organization, inviting members, and understanding plans |
| **Troubleshooting** | Common errors, FAQ, and a glossary of terms |
## Ready to start?
Go from zero to your first prediction in 10 minutes.
Understand the building blocks before diving in.
## What can you do with Chemolytic?
Import spectroscopy data from CSV files, create samples, and define the properties you want to predict.
Visualize spectra, run PCA, t-SNE, or K-Means clustering to understand patterns before modelling.
Let CoPilot test 250+ preprocessing and model combinations, or configure everything manually in Scientist Mode.
Deploy your best model as an endpoint and get predictions on new spectra instantly.
## Who is this for?
* **Quality control teams** who need to predict properties (moisture, protein, fat) from spectra
* **Lab managers** who want to reduce wet chemistry costs
* **R\&D scientists** exploring spectral datasets for patterns
* **Process engineers** monitoring production lines with inline spectrometers
* **Students and researchers** learning chemometrics without needing to code
## How this documentation is organized
| Section | What you'll find |
| ------------------- | ------------------------------------------------------------------------------ |
| **Getting started** | Account setup, your first project, and key concepts |
| **Core concepts** | What sensors, samples, spectra, datasets, and preprocessing mean in Chemolytic |
| **Guides** | Step-by-step walkthroughs for every feature, with screenshots |
| **Team & billing** | Managing your organization, inviting members, and understanding plans |
| **Troubleshooting** | Common errors, FAQ, and a glossary of terms |
## Ready to start?
Go from zero to your first prediction in 10 minutes.
Understand the building blocks before diving in.