> ## Documentation Index
> Fetch the complete documentation index at: https://docs.chemolytic.com/llms.txt
> Use this file to discover all available pages before exploring further.
# t-SNE
> t-SNE produces 2D maps that reveal cluster structure. Useful when PCA shows nothing obvious.
t-SNE (t-Distributed Stochastic Neighbor Embedding) is a non-linear dimensionality reduction method. Unlike PCA, which rotates the data linearly, t-SNE is designed to **preserve local neighbourhoods**: samples that are similar in the original space stay close together in the 2D map, while dissimilar samples get pushed apart.
t-SNE is useful for:
* Spotting **non-linear clusters** that PCA misses
* Quick visual check for natural groupings
* Communicating data structure to non-technical stakeholders
t-SNE is for visualization, not modelling. The 2D coordinates are not directly comparable across runs (different random seeds produce different layouts). Don't use t-SNE coordinates as features for prediction.
## Configuring a t-SNE run
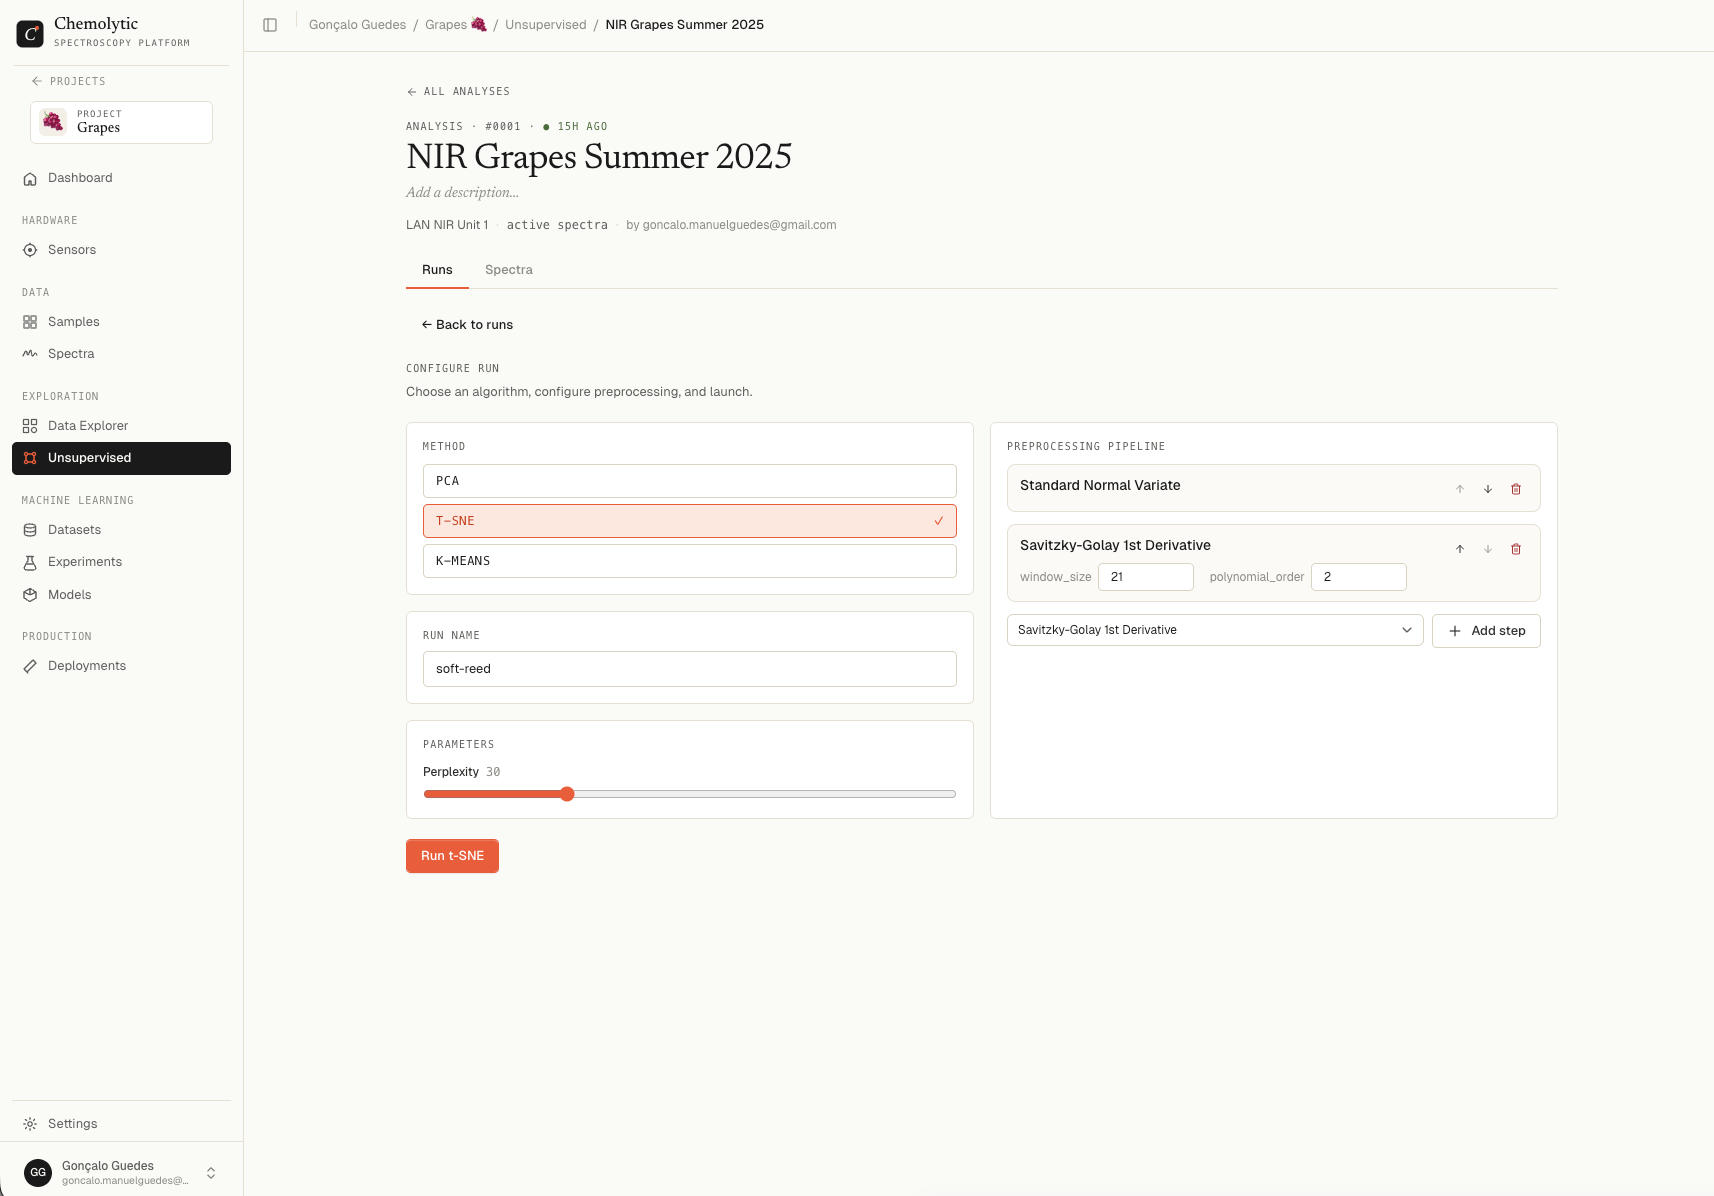
In the **Configure run** card on the analysis detail page, select **t-SNE**.
 ### Parameters
| Parameter | Default | Range | Description |
| -------------- | ------- | ------------ | -------------------------------------------------------------------------------------------------------------------------------- |
| **Perplexity** | 30.0 | 5.0 to 100.0 | Controls how t-SNE balances local vs. global structure. Roughly the number of effective neighbours each point pays attention to. |
#### Choosing perplexity
| Sample count | Suggested perplexity |
| ------------ | -------------------- |
| 30-100 | 5-15 |
| 100-500 | 20-40 |
| 500-2000 | 30-50 |
| 2000+ | 50-80 |
If the result looks like a single blob, lower the perplexity. If it shatters into many tiny groups, raise it. Try a few values: there's no single "right" answer.
Click **Launch run**. Status goes through "Queueing", "Analysing", "Done".
## Reading the results
### Parameters
| Parameter | Default | Range | Description |
| -------------- | ------- | ------------ | -------------------------------------------------------------------------------------------------------------------------------- |
| **Perplexity** | 30.0 | 5.0 to 100.0 | Controls how t-SNE balances local vs. global structure. Roughly the number of effective neighbours each point pays attention to. |
#### Choosing perplexity
| Sample count | Suggested perplexity |
| ------------ | -------------------- |
| 30-100 | 5-15 |
| 100-500 | 20-40 |
| 500-2000 | 30-50 |
| 2000+ | 50-80 |
If the result looks like a single blob, lower the perplexity. If it shatters into many tiny groups, raise it. Try a few values: there's no single "right" answer.
Click **Launch run**. Status goes through "Queueing", "Analysing", "Done".
## Reading the results
 ### Embedding plot
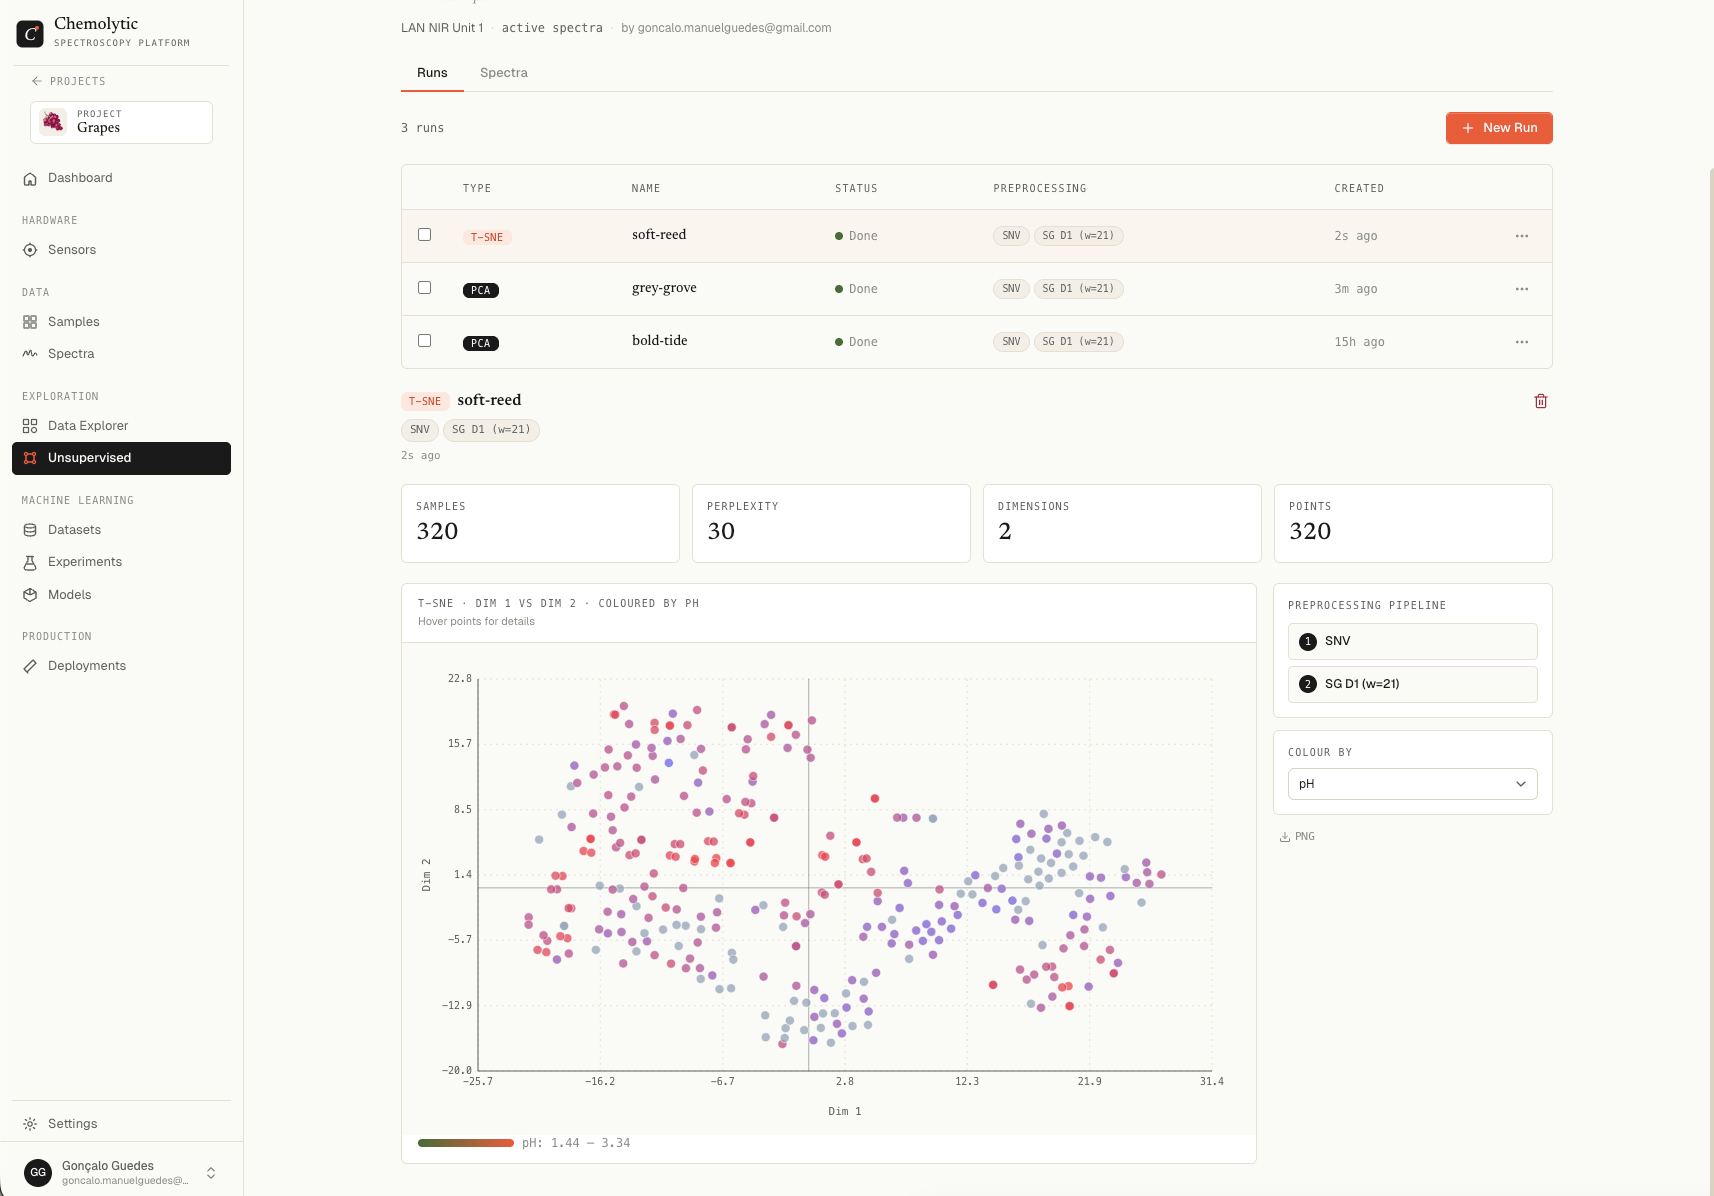
A 2D scatter plot. Dim 1 is the horizontal axis, Dim 2 is the vertical axis. Each point is one spectrum.
The axes themselves have **no inherent meaning** in t-SNE. Only relative distances between points matter:
* Points close together = similar spectra
* Points far apart = dissimilar spectra
* Point clusters = natural groupings
### Colour by
Pick a property to colour the points. If samples coloured by a property segregate into distinct regions of the map, that property has a strong signal in your spectra.
### Common patterns
| Pattern | Likely meaning |
| -------------------------- | -------------------------------------------------- |
| One single blob | No strong structure (or perplexity too high) |
| Clear separated clusters | Natural groups in your data |
| Long curved manifold | Continuous variation along some property |
| Coloured property gradient | Property is well-correlated with spectral features |
## Limitations
* **Stochastic**: every run produces a different layout, even with the same parameters
* **No global meaning**: distances between far-apart clusters are not meaningful
* **Slow on large datasets**: 10,000+ samples take noticeably longer
* **Sensitive to parameters**: small perplexity changes can produce very different maps
For these reasons, use t-SNE alongside PCA, not as a replacement. PCA gives you reproducible global structure; t-SNE gives you visual cluster intuition.
## Comparing t-SNE runs
t-SNE embeddings are independent across runs (different random initializations). When you [compare runs](/explorer/comparing-runs), the comparison shows each run's embedding side by side. Don't expect points in run A to land in the same place as run B; only the cluster structure is meaningful.
### Embedding plot
A 2D scatter plot. Dim 1 is the horizontal axis, Dim 2 is the vertical axis. Each point is one spectrum.
The axes themselves have **no inherent meaning** in t-SNE. Only relative distances between points matter:
* Points close together = similar spectra
* Points far apart = dissimilar spectra
* Point clusters = natural groupings
### Colour by
Pick a property to colour the points. If samples coloured by a property segregate into distinct regions of the map, that property has a strong signal in your spectra.
### Common patterns
| Pattern | Likely meaning |
| -------------------------- | -------------------------------------------------- |
| One single blob | No strong structure (or perplexity too high) |
| Clear separated clusters | Natural groups in your data |
| Long curved manifold | Continuous variation along some property |
| Coloured property gradient | Property is well-correlated with spectral features |
## Limitations
* **Stochastic**: every run produces a different layout, even with the same parameters
* **No global meaning**: distances between far-apart clusters are not meaningful
* **Slow on large datasets**: 10,000+ samples take noticeably longer
* **Sensitive to parameters**: small perplexity changes can produce very different maps
For these reasons, use t-SNE alongside PCA, not as a replacement. PCA gives you reproducible global structure; t-SNE gives you visual cluster intuition.
## Comparing t-SNE runs
t-SNE embeddings are independent across runs (different random initializations). When you [compare runs](/explorer/comparing-runs), the comparison shows each run's embedding side by side. Don't expect points in run A to land in the same place as run B; only the cluster structure is meaningful.