> ## Documentation Index
> Fetch the complete documentation index at: https://docs.chemolytic.com/llms.txt
> Use this file to discover all available pages before exploring further.
# K-Means
> Group samples into N clusters automatically. Useful when you suspect categorical structure in continuous data.
K-Means clustering partitions your samples into **k groups** based on spectral similarity. You pick k, the algorithm assigns each sample to one of the k clusters.
K-Means is useful for:
* Discovering **unknown classes** in your data (e.g., variety, origin, defect type)
* Validating that an expected categorization is actually visible in spectra
* Generating cluster labels that you can promote to a categorical property
## Configuring a K-Means run
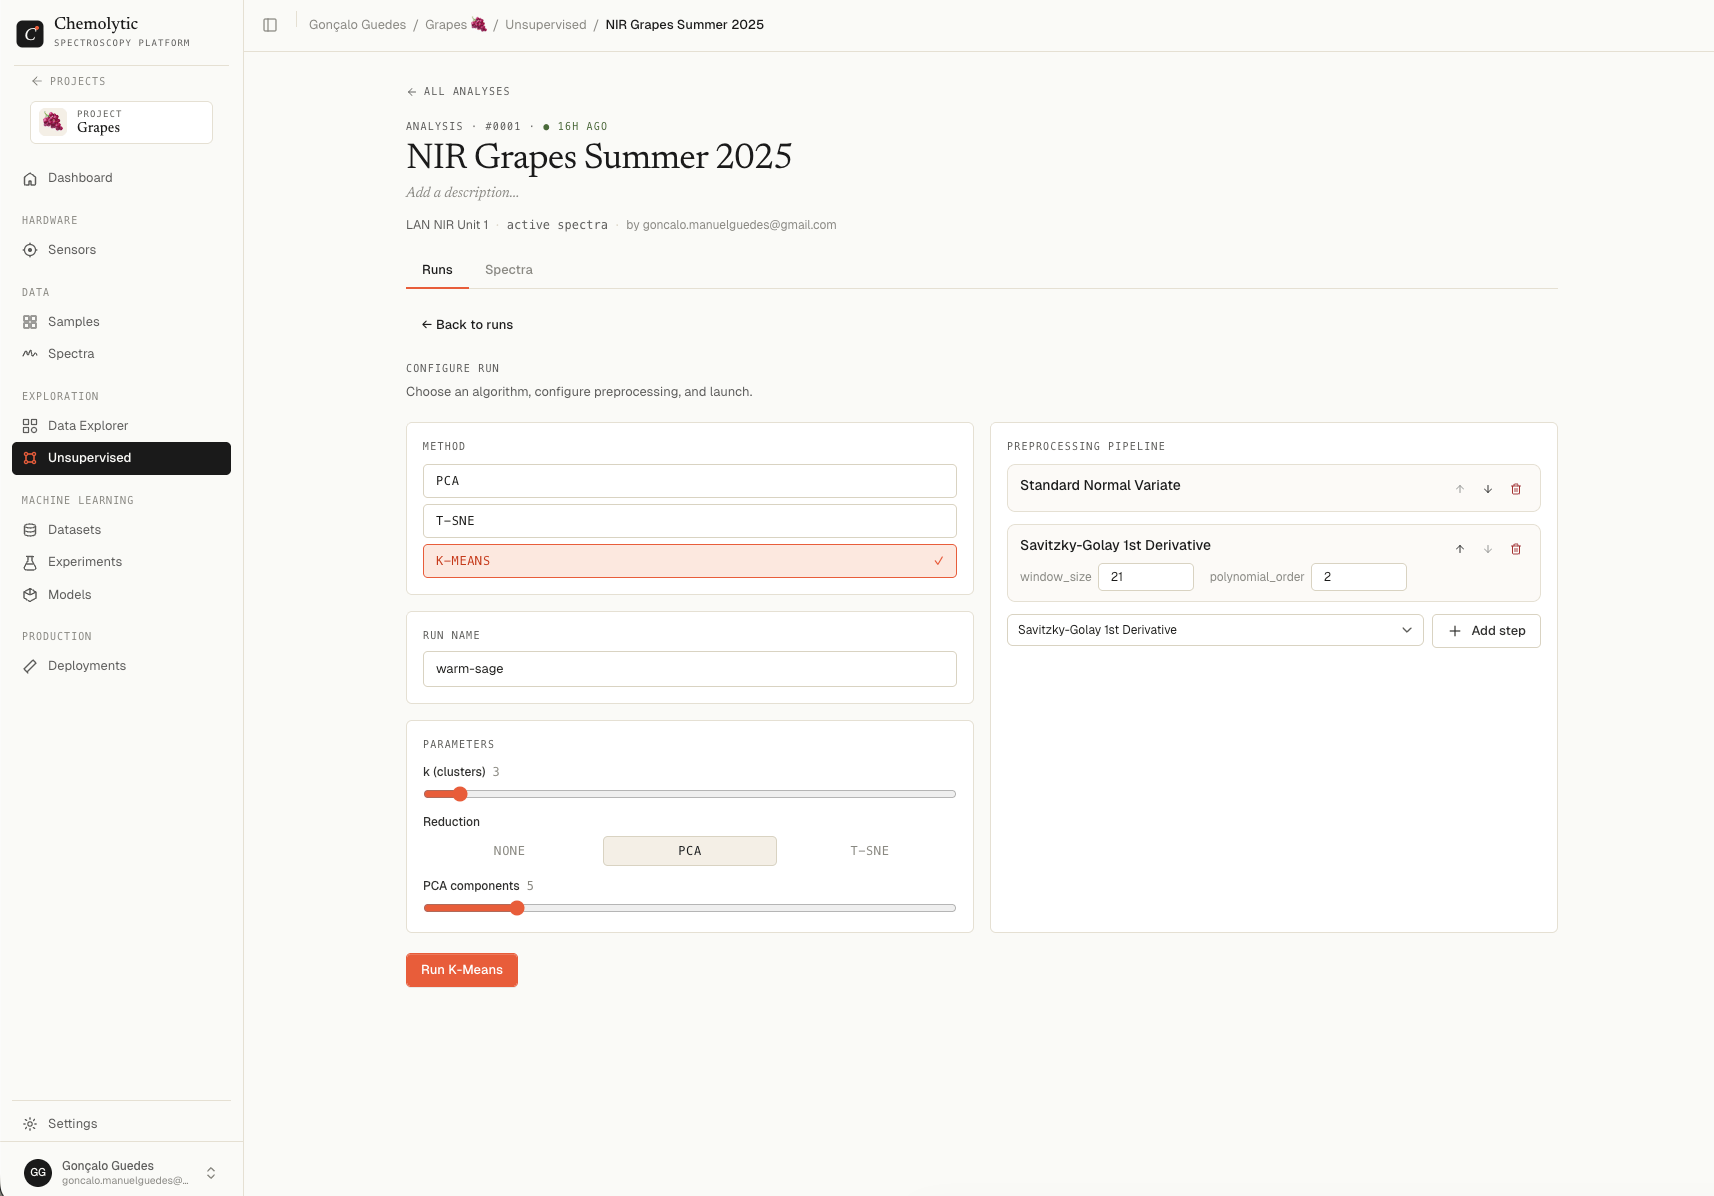
In the **Configure run** card on the analysis detail page, select **K-Means**.
 ### Parameters
| Parameter | Default | Range | Description |
| ---------------- | ------- | ------------------ | ---------------------------------------------- |
| **k (clusters)** | 3 | 2 to 20 | Number of groups to find |
| **Reduction** | NONE | NONE / PCA / t-SNE | Whether to reduce dimensions before clustering |
### Choosing k
| Strategy | When to use |
| -------------------- | ------------------------------------------------------- |
| **Domain knowledge** | You know there should be 3 grades, set k = 3 |
| **Try a range** | Run k = 2, 3, 4, 5 and compare silhouette scores |
| **PCA hint** | Look at your PCA scores plot and count visible clusters |
Start with k = 2 or 3. Higher values of k almost always reduce within-cluster variance (lower inertia) but the clusters become harder to interpret. The silhouette score helps you find the sweet spot.
### Reduction
By default, K-Means runs on the full preprocessed spectra. You can optionally reduce dimensions first:
| Reduction | Effect |
| --------- | ---------------------------------------------------------------------- |
| **NONE** | Cluster on full spectra (default, most accurate) |
| **PCA** | Cluster on the top N principal components (faster, less noisy) |
| **t-SNE** | Cluster on the 2D t-SNE embedding (good for tight non-linear clusters) |
When you select **PCA**, an additional **PCA components** slider appears (default 5).
When you select **t-SNE**, a **Perplexity** slider appears (default 30).
Clustering on a t-SNE embedding can create misleading clusters. t-SNE distorts global distances so the resulting clusters may not reflect real spectral similarity. Use NONE or PCA reduction unless you have a specific reason.
Click **Launch run**.
## Reading the results
### Parameters
| Parameter | Default | Range | Description |
| ---------------- | ------- | ------------------ | ---------------------------------------------- |
| **k (clusters)** | 3 | 2 to 20 | Number of groups to find |
| **Reduction** | NONE | NONE / PCA / t-SNE | Whether to reduce dimensions before clustering |
### Choosing k
| Strategy | When to use |
| -------------------- | ------------------------------------------------------- |
| **Domain knowledge** | You know there should be 3 grades, set k = 3 |
| **Try a range** | Run k = 2, 3, 4, 5 and compare silhouette scores |
| **PCA hint** | Look at your PCA scores plot and count visible clusters |
Start with k = 2 or 3. Higher values of k almost always reduce within-cluster variance (lower inertia) but the clusters become harder to interpret. The silhouette score helps you find the sweet spot.
### Reduction
By default, K-Means runs on the full preprocessed spectra. You can optionally reduce dimensions first:
| Reduction | Effect |
| --------- | ---------------------------------------------------------------------- |
| **NONE** | Cluster on full spectra (default, most accurate) |
| **PCA** | Cluster on the top N principal components (faster, less noisy) |
| **t-SNE** | Cluster on the 2D t-SNE embedding (good for tight non-linear clusters) |
When you select **PCA**, an additional **PCA components** slider appears (default 5).
When you select **t-SNE**, a **Perplexity** slider appears (default 30).
Clustering on a t-SNE embedding can create misleading clusters. t-SNE distorts global distances so the resulting clusters may not reflect real spectral similarity. Use NONE or PCA reduction unless you have a specific reason.
Click **Launch run**.
## Reading the results
 ### Metrics table
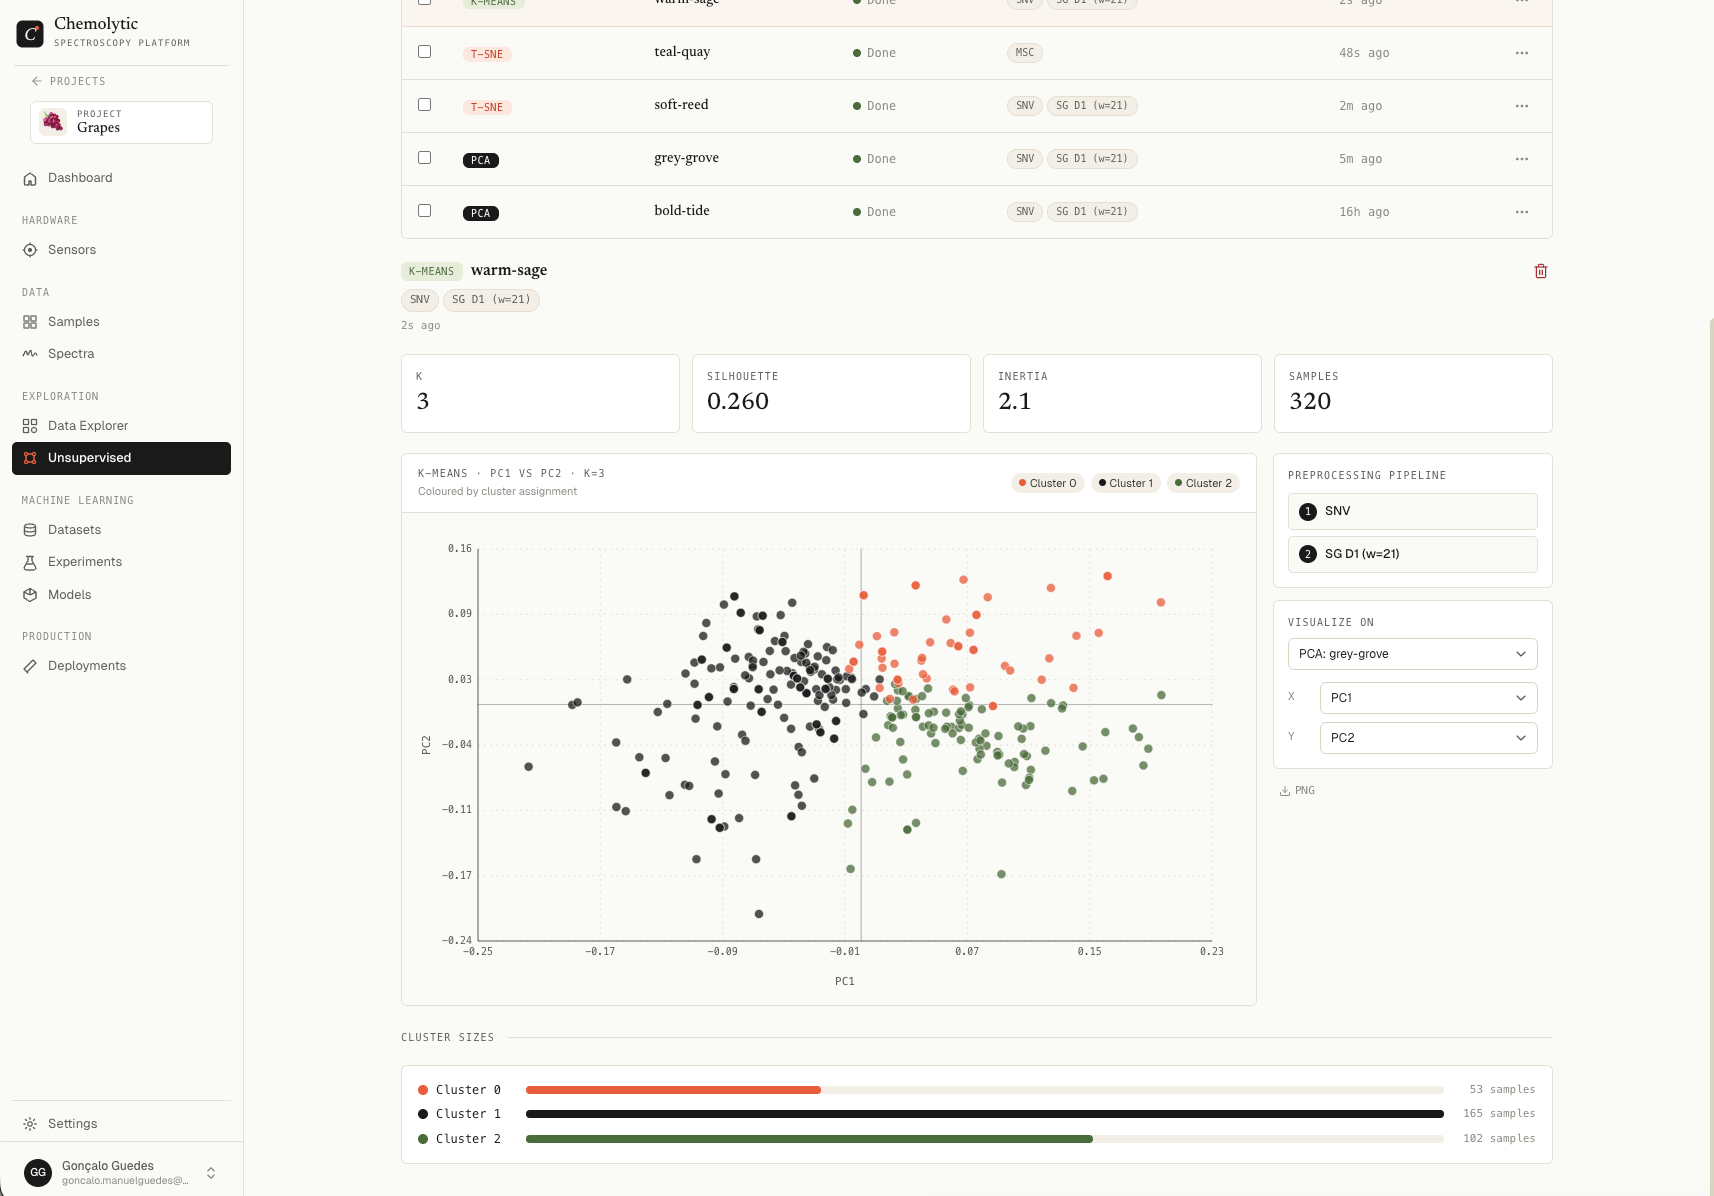
| Metric | What it tells you |
| -------------- | -------------------------------------------------------------------------------------- |
| **k** | The number of clusters used |
| **Silhouette** | How well-separated the clusters are. Range: -1 to +1. Higher is better. |
| **Inertia** | Total within-cluster sum of squares. Lower is better. Always decreases as k increases. |
| **Samples** | How many samples were clustered |
#### Silhouette interpretation
| Silhouette | Meaning |
| ----------- | -------------------------- |
| 0.7 to 1.0 | Strong cluster structure |
| 0.5 to 0.7 | Reasonable structure |
| 0.25 to 0.5 | Weak, overlapping clusters |
| Below 0.25 | No real cluster structure |
Run K-Means with several values of k and pick the one with the highest silhouette. This is the most reliable way to find the natural number of clusters in your data.
### Cluster sizes
Horizontal bar chart showing how many samples fell into each cluster. Each cluster gets a colour from the palette.
| Pattern | Meaning |
| ----------------------------------- | ------------------------------------------------ |
| Roughly equal sizes | Balanced grouping |
| One cluster much larger than others | The data has one dominant group plus outliers |
| Many tiny clusters | k is probably too high |
| Two of similar size | Clear binary structure (good for classification) |
## What to do with cluster labels
Once K-Means finds clusters that match what you expected (e.g., the silhouette is high and the cluster sizes are reasonable), you can:
1. **Validate**: open each cluster and look at the original samples. Are they meaningfully similar?
2. **Promote**: create a new categorical property called something like "K-Means group" with categories matching the cluster IDs, then assign each sample to its cluster
3. **Train a classifier**: use the new property as the target in an Experiment to train a model that predicts cluster membership from spectra
This last step is useful when the clusters represent something physically meaningful that you didn't have property data for originally.
## Limitations
* **K must be set in advance**: K-Means doesn't find the "right" number of clusters on its own
* **Spherical assumption**: K-Means assumes clusters are roughly round. Long, curved structures get cut into pieces
* **Sensitive to scale**: preprocessing matters a lot. SNV or autoscale before K-Means
* **Random initialization**: results can vary slightly between runs even with the same k
### Metrics table
| Metric | What it tells you |
| -------------- | -------------------------------------------------------------------------------------- |
| **k** | The number of clusters used |
| **Silhouette** | How well-separated the clusters are. Range: -1 to +1. Higher is better. |
| **Inertia** | Total within-cluster sum of squares. Lower is better. Always decreases as k increases. |
| **Samples** | How many samples were clustered |
#### Silhouette interpretation
| Silhouette | Meaning |
| ----------- | -------------------------- |
| 0.7 to 1.0 | Strong cluster structure |
| 0.5 to 0.7 | Reasonable structure |
| 0.25 to 0.5 | Weak, overlapping clusters |
| Below 0.25 | No real cluster structure |
Run K-Means with several values of k and pick the one with the highest silhouette. This is the most reliable way to find the natural number of clusters in your data.
### Cluster sizes
Horizontal bar chart showing how many samples fell into each cluster. Each cluster gets a colour from the palette.
| Pattern | Meaning |
| ----------------------------------- | ------------------------------------------------ |
| Roughly equal sizes | Balanced grouping |
| One cluster much larger than others | The data has one dominant group plus outliers |
| Many tiny clusters | k is probably too high |
| Two of similar size | Clear binary structure (good for classification) |
## What to do with cluster labels
Once K-Means finds clusters that match what you expected (e.g., the silhouette is high and the cluster sizes are reasonable), you can:
1. **Validate**: open each cluster and look at the original samples. Are they meaningfully similar?
2. **Promote**: create a new categorical property called something like "K-Means group" with categories matching the cluster IDs, then assign each sample to its cluster
3. **Train a classifier**: use the new property as the target in an Experiment to train a model that predicts cluster membership from spectra
This last step is useful when the clusters represent something physically meaningful that you didn't have property data for originally.
## Limitations
* **K must be set in advance**: K-Means doesn't find the "right" number of clusters on its own
* **Spherical assumption**: K-Means assumes clusters are roughly round. Long, curved structures get cut into pieces
* **Sensitive to scale**: preprocessing matters a lot. SNV or autoscale before K-Means
* **Random initialization**: results can vary slightly between runs even with the same k