> ## Documentation Index
> Fetch the complete documentation index at: https://docs.chemolytic.com/llms.txt
> Use this file to discover all available pages before exploring further.
# Data Explorer
> Check whether your data is ready for modelling and inspect the distribution of every property.
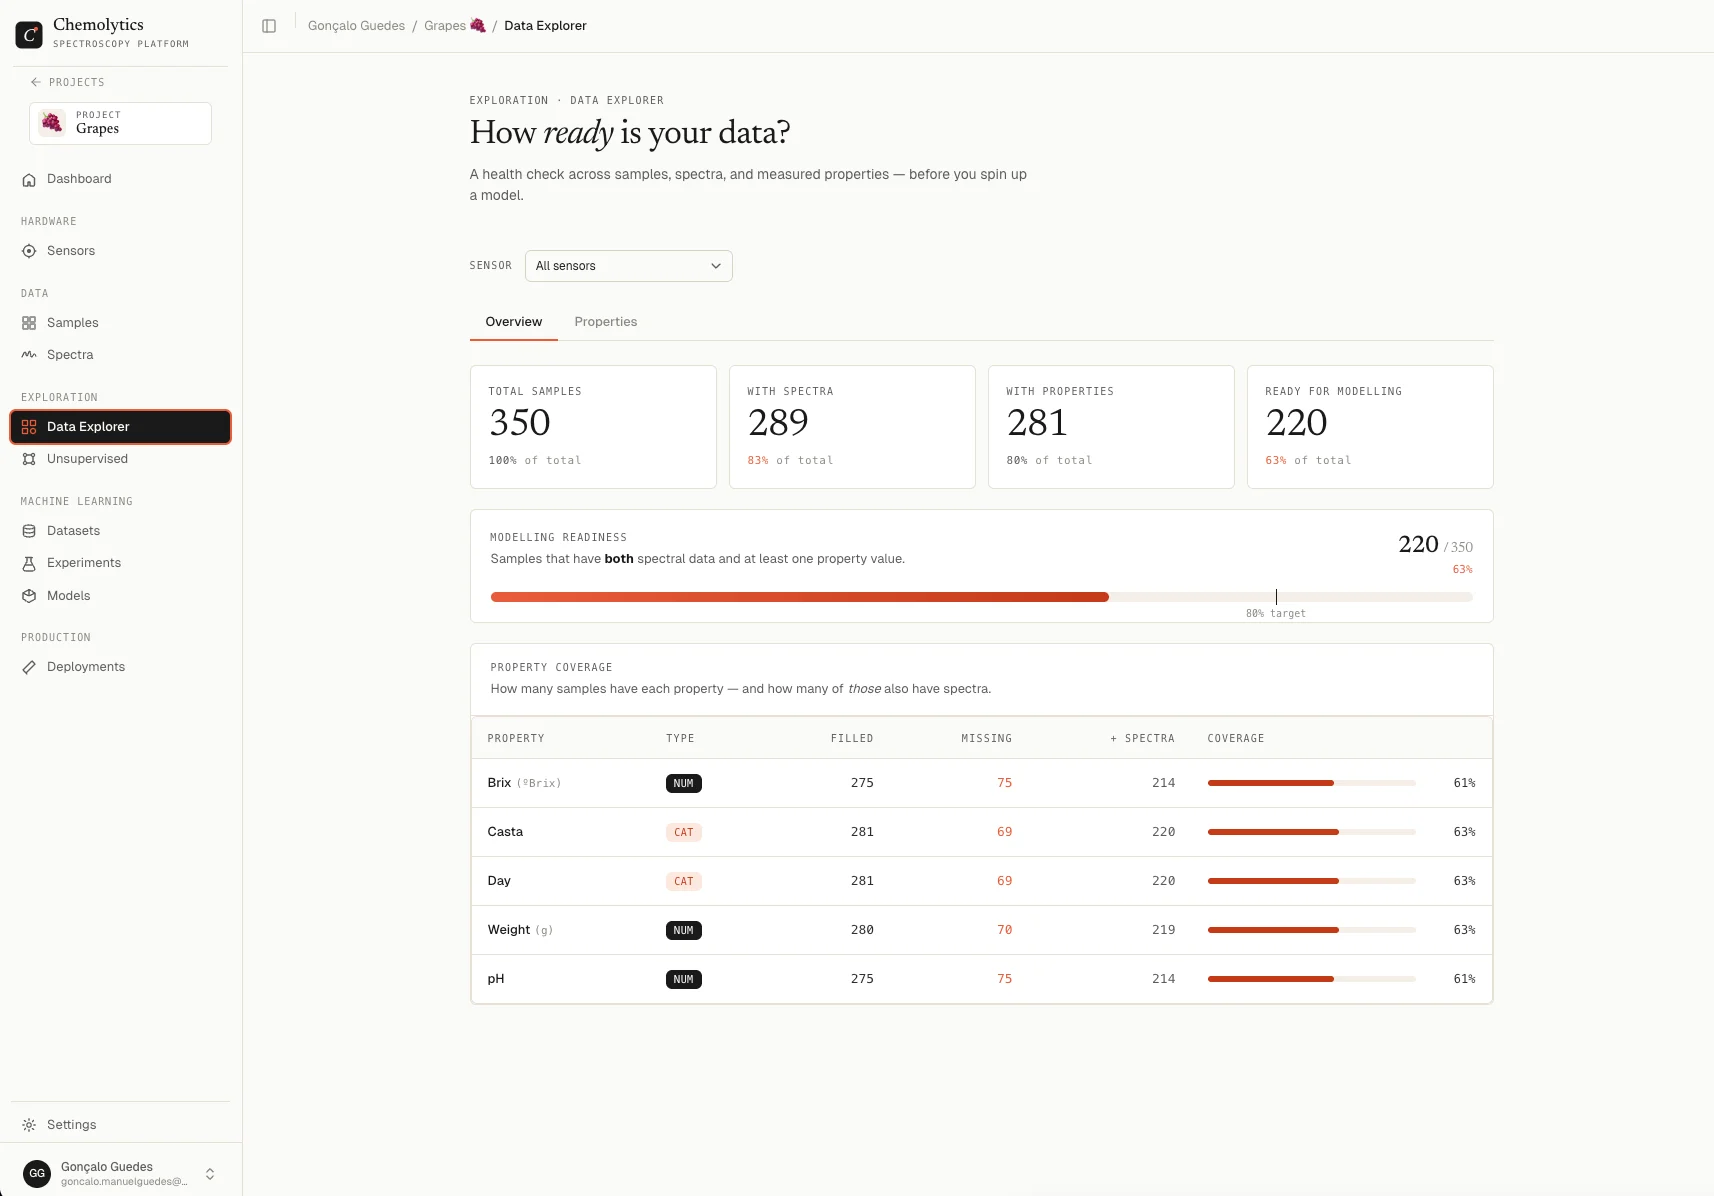
The Data Explorer is a health check across your samples, spectra, and properties. Use it before training any model to spot missing data, imbalanced categories, and outliers in your property values.
Go to **Data Explorer** in the project sidebar.
 ## Sensor filter
By default, all sensors are included. Use the **Sensor** dropdown at the top to focus on a specific instrument. Click **Clear** to go back to all sensors.
This filter affects every metric on the page: counts, modelling readiness, and property statistics are all computed only on samples linked to the selected sensor.
## Overview tab
### Stat tiles
Four numbers across the top:
| Tile | What it counts |
| ----------------------- | -------------------------------------------------------------------------------- |
| **Total samples** | Every sample in the project (or filtered by sensor) |
| **With spectra** | Samples that have at least one spectrum uploaded |
| **With properties** | Samples that have at least one property value set |
| **Ready for modelling** | Samples that have **both** at least one spectrum and at least one property value |
The "Ready for modelling" number is the only one that matters for training. Samples missing spectra or property values cannot contribute to a model.
### Modelling readiness bar
Shows the same "Ready for modelling" number as a progress bar, with a vertical tick at 80%.
80% is a healthy target. If most of your samples are missing either spectra or property values, fix that before running experiments. A model is only as good as the data behind it.
### Property coverage
The table below shows, for each property:
| Column | Description |
| ------------- | ------------------------------------------------ |
| **Property** | Property name and unit |
| **Type** | Continuous (Num) or Categorical (Cat) |
| **Filled** | Samples with a value for this property |
| **Missing** | Samples without a value (red if any are missing) |
| **+ Spectra** | Of the filled ones, how many also have spectra |
| **Coverage** | Visual bar with percentage |
Coverage colors:
* **Green** (95% or higher): excellent coverage
* **Orange** (70-94%): acceptable, but watch for bias
* **Red** (below 70%): risky to model from
## Properties tab
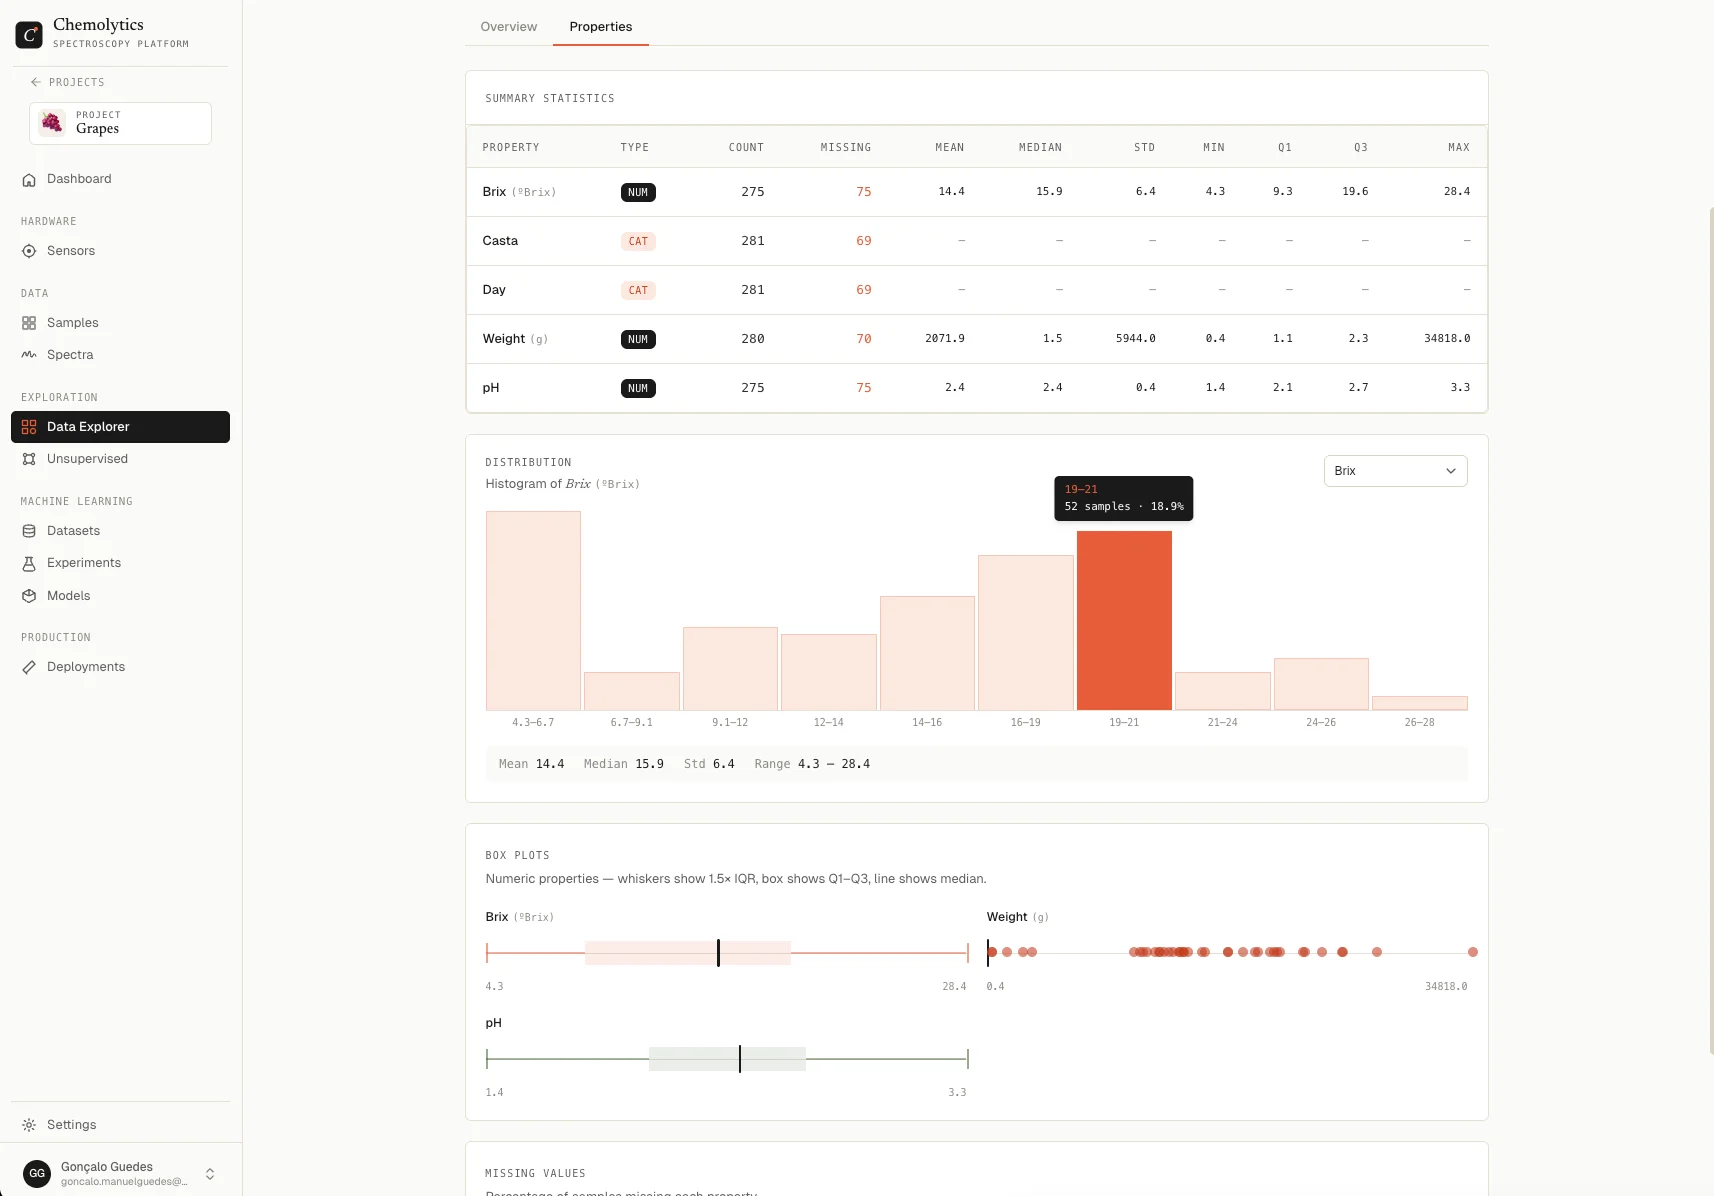
The Properties tab shows distribution statistics for every property.
## Sensor filter
By default, all sensors are included. Use the **Sensor** dropdown at the top to focus on a specific instrument. Click **Clear** to go back to all sensors.
This filter affects every metric on the page: counts, modelling readiness, and property statistics are all computed only on samples linked to the selected sensor.
## Overview tab
### Stat tiles
Four numbers across the top:
| Tile | What it counts |
| ----------------------- | -------------------------------------------------------------------------------- |
| **Total samples** | Every sample in the project (or filtered by sensor) |
| **With spectra** | Samples that have at least one spectrum uploaded |
| **With properties** | Samples that have at least one property value set |
| **Ready for modelling** | Samples that have **both** at least one spectrum and at least one property value |
The "Ready for modelling" number is the only one that matters for training. Samples missing spectra or property values cannot contribute to a model.
### Modelling readiness bar
Shows the same "Ready for modelling" number as a progress bar, with a vertical tick at 80%.
80% is a healthy target. If most of your samples are missing either spectra or property values, fix that before running experiments. A model is only as good as the data behind it.
### Property coverage
The table below shows, for each property:
| Column | Description |
| ------------- | ------------------------------------------------ |
| **Property** | Property name and unit |
| **Type** | Continuous (Num) or Categorical (Cat) |
| **Filled** | Samples with a value for this property |
| **Missing** | Samples without a value (red if any are missing) |
| **+ Spectra** | Of the filled ones, how many also have spectra |
| **Coverage** | Visual bar with percentage |
Coverage colors:
* **Green** (95% or higher): excellent coverage
* **Orange** (70-94%): acceptable, but watch for bias
* **Red** (below 70%): risky to model from
## Properties tab
The Properties tab shows distribution statistics for every property.
 ### Continuous properties
Each continuous property shows:
| Stat | Description |
| ----------------- | --------------------------- |
| **Mean** | Average of all values |
| **Median** | Middle value when sorted |
| **Std** | Standard deviation (spread) |
| **Min** / **Max** | Lowest and highest values |
| **Q1** / **Q3** | First and third quartiles |
A **histogram** plots the distribution across 10 bins. Use it to spot:
* Skewed distributions (most values clustered on one end)
* Bimodal patterns (two peaks suggesting two underlying groups)
* Gaps where data is missing in a range
A **box plot** shows the same data as a box-and-whisker chart with outliers marked as scatter points using the Tukey method (1.5 × IQR).
If your property has heavy outliers, your model may overfit to them. Consider whether those outliers are real measurements or data entry errors before training.
### Categorical properties
Each categorical property shows a donut chart of category counts with the total in the centre and a per-category breakdown (count and percentage) on the side.
### Continuous properties
Each continuous property shows:
| Stat | Description |
| ----------------- | --------------------------- |
| **Mean** | Average of all values |
| **Median** | Middle value when sorted |
| **Std** | Standard deviation (spread) |
| **Min** / **Max** | Lowest and highest values |
| **Q1** / **Q3** | First and third quartiles |
A **histogram** plots the distribution across 10 bins. Use it to spot:
* Skewed distributions (most values clustered on one end)
* Bimodal patterns (two peaks suggesting two underlying groups)
* Gaps where data is missing in a range
A **box plot** shows the same data as a box-and-whisker chart with outliers marked as scatter points using the Tukey method (1.5 × IQR).
If your property has heavy outliers, your model may overfit to them. Consider whether those outliers are real measurements or data entry errors before training.
### Categorical properties
Each categorical property shows a donut chart of category counts with the total in the centre and a per-category breakdown (count and percentage) on the side.
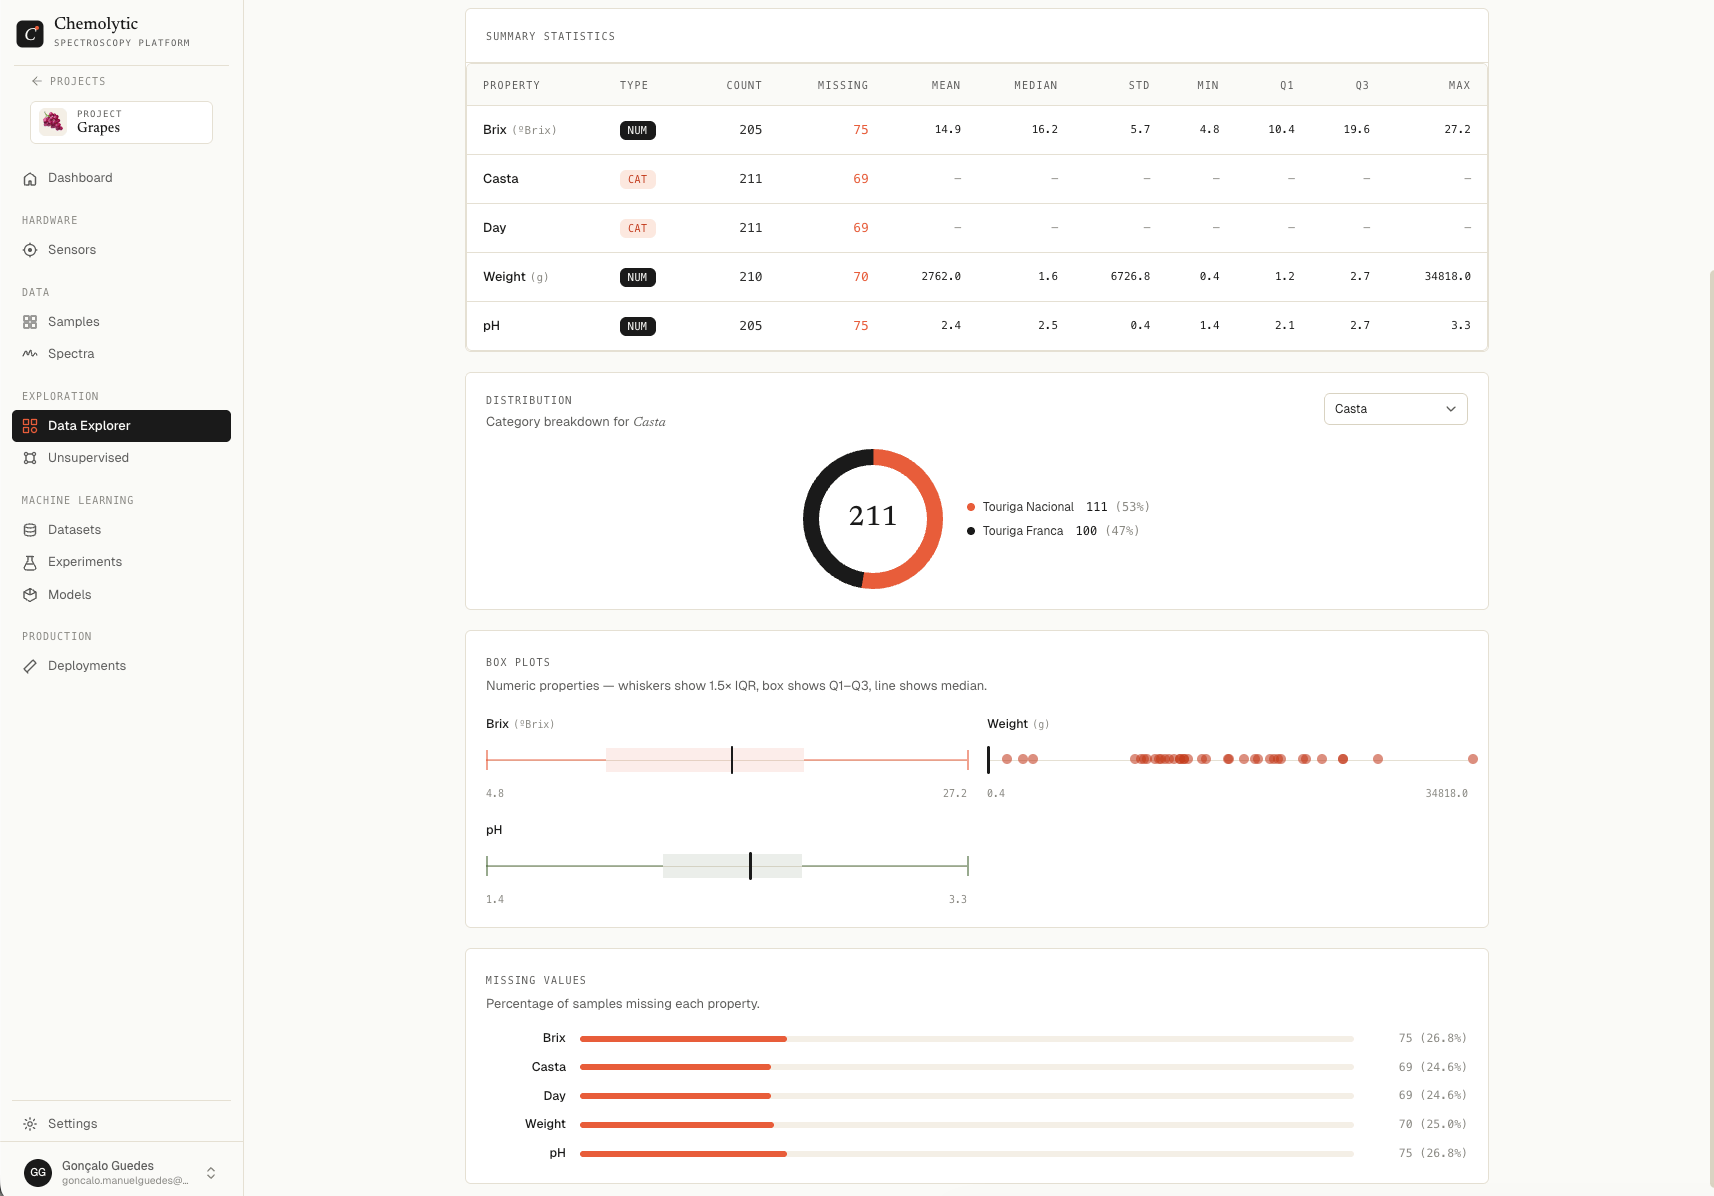 For classification, make sure your categories are reasonably balanced. A property with 95% in one class and 5% in another is hard to model. You may need to gather more samples in the minority categories.
## When to come back
Visit the Data Explorer:
* **After uploading spectra**: confirm the readiness number went up
* **After importing samples via CSV**: check property coverage didn't introduce gaps
* **Before running an experiment**: spot any imbalance or outliers that could bias the model
* **After deleting samples**: confirm coverage is still acceptable
For classification, make sure your categories are reasonably balanced. A property with 95% in one class and 5% in another is hard to model. You may need to gather more samples in the minority categories.
## When to come back
Visit the Data Explorer:
* **After uploading spectra**: confirm the readiness number went up
* **After importing samples via CSV**: check property coverage didn't introduce gaps
* **Before running an experiment**: spot any imbalance or outliers that could bias the model
* **After deleting samples**: confirm coverage is still acceptable