> ## Documentation Index
> Fetch the complete documentation index at: https://docs.chemolytic.com/llms.txt
> Use this file to discover all available pages before exploring further.
# Spectra
> View, archive, and manage spectra in your project.
A spectrum is one measurement from your sensor: a curve of intensity values across wavelengths or wavenumbers. Spectra are the raw input to all model training in Chemolytic.
## Spectra page
Go to **Spectra** in the project sidebar.
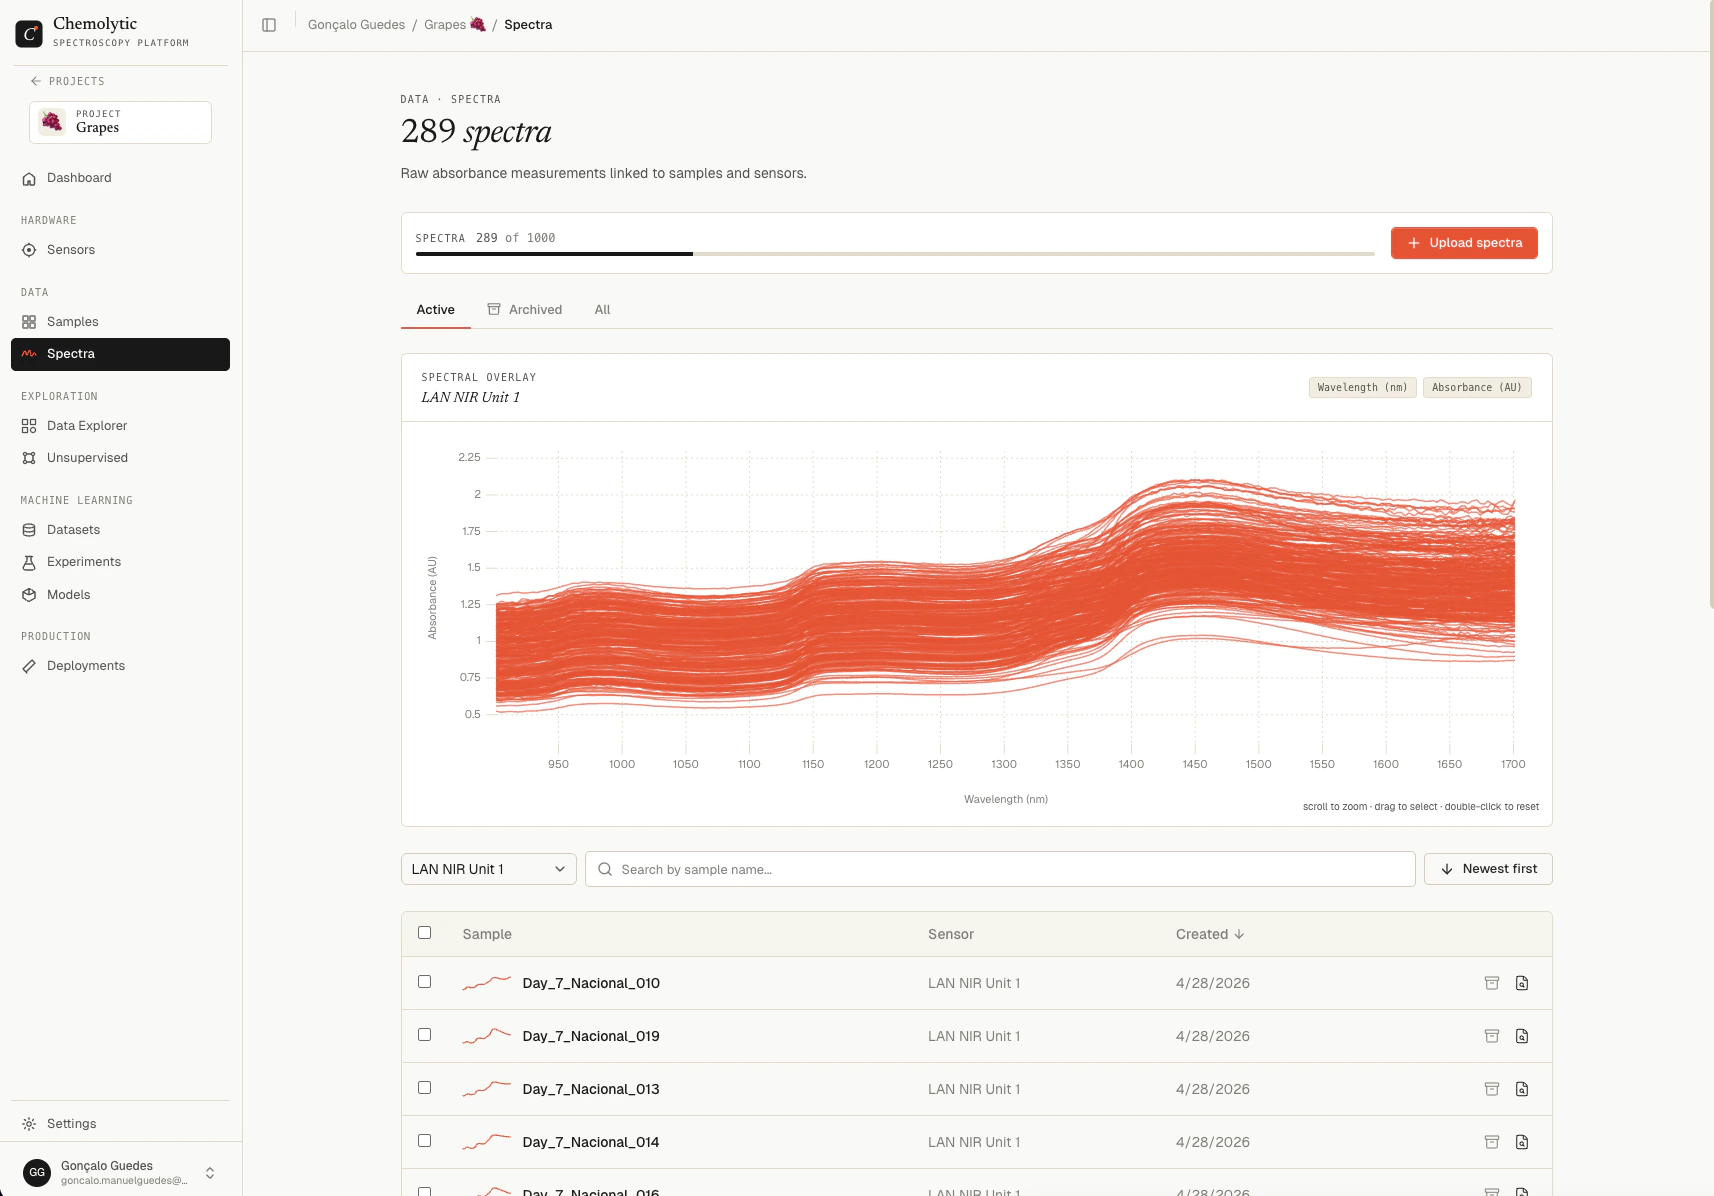 The page has three sections:
1. **Filters**: sensor selector, search box, archive tabs (Active / Archived / All)
2. **Chart preview**: shows all spectra for the selected sensor overlaid
3. **Table**: one row per spectrum with sample name, sensor, creation date, and a sparkline preview
### Sensor filter
The sensor dropdown is the most important filter. Each sensor has its own x-axis, so you cannot meaningfully overlay spectra from different sensors. The chart preview only appears when a sensor is selected.
We're working on multi-sensor plotting. The first version will support overlaying spectra from sensors of the **same model** (since they share the same x-axis). A later release will support overlaying across different models with automatic alignment.
### Archive tabs
| Tab | Shows |
| ------------ | ----------------------------------- |
| **Active** | Non-archived spectra (default view) |
| **Archived** | Archived spectra |
| **All** | Both active and archived |
### Search
Type in the search box to filter the visible rows by sample name.
### Sort
Toggle between **Newest first** and **Oldest first** using the sort button.
### Plan limits
The plan limit on spectra per project is shown at the top. Archived spectra count toward the limit. Delete archived spectra you no longer need to free up quota.
## Viewing a spectrum
Click any row in the table to open the spectrum detail panel.
The page has three sections:
1. **Filters**: sensor selector, search box, archive tabs (Active / Archived / All)
2. **Chart preview**: shows all spectra for the selected sensor overlaid
3. **Table**: one row per spectrum with sample name, sensor, creation date, and a sparkline preview
### Sensor filter
The sensor dropdown is the most important filter. Each sensor has its own x-axis, so you cannot meaningfully overlay spectra from different sensors. The chart preview only appears when a sensor is selected.
We're working on multi-sensor plotting. The first version will support overlaying spectra from sensors of the **same model** (since they share the same x-axis). A later release will support overlaying across different models with automatic alignment.
### Archive tabs
| Tab | Shows |
| ------------ | ----------------------------------- |
| **Active** | Non-archived spectra (default view) |
| **Archived** | Archived spectra |
| **All** | Both active and archived |
### Search
Type in the search box to filter the visible rows by sample name.
### Sort
Toggle between **Newest first** and **Oldest first** using the sort button.
### Plan limits
The plan limit on spectra per project is shown at the top. Archived spectra count toward the limit. Delete archived spectra you no longer need to free up quota.
## Viewing a spectrum
Click any row in the table to open the spectrum detail panel.
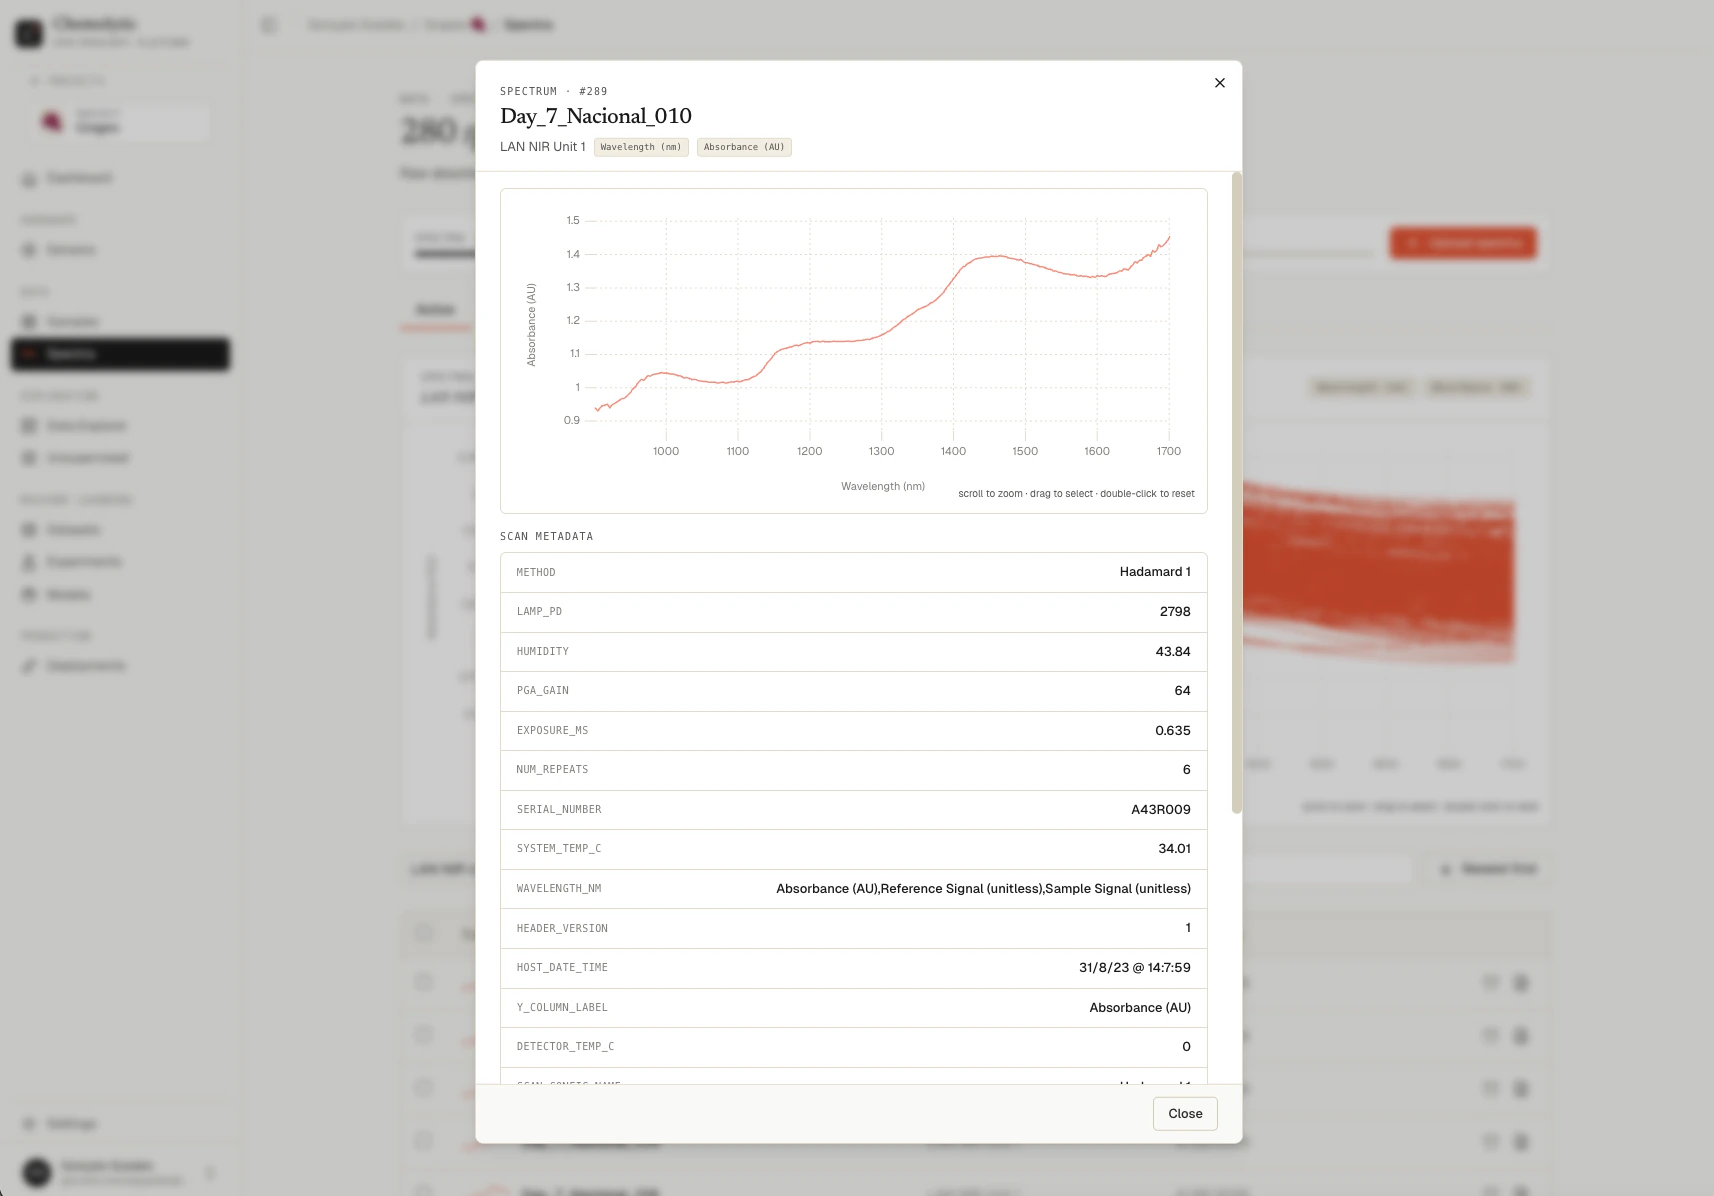 The detail panel shows:
* The interactive chart for this spectrum
* Sample name and linked sensor
* Sensor units (x and y)
* Metadata extracted from the original file (if any)
* Creation date and spectrum ID
## Archiving a spectrum
Archive is a **reversible** soft delete. Archived spectra:
* Are hidden from the Active tab
* Cannot be used in new datasets or analyses
* Still count toward your plan's spectra limit
* Can be unarchived at any time
To archive, open a spectrum and click **Archive**, or select multiple rows and click **Archive N** in the selection toolbar.
To unarchive, switch to the **Archived** tab, open a spectrum, and click **Unarchive**.
Use archive when you want to remove a spectrum from active modelling (because it's an outlier or measurement error) but might still need it later for reference.
## Deleting a spectrum
Delete is **permanent**. Deleted spectra cannot be recovered.
You can only delete spectra that have been **archived first**. The delete button is hidden on active spectra. Archive a spectrum before you can delete it.
From the Active tab, archive any spectra you want to delete.
Click the **Archived** tab.
Open the spectrum (or select multiple) and click **Delete**. A confirmation dialog appears with the warning "Irreversible action".
## Bulk operations
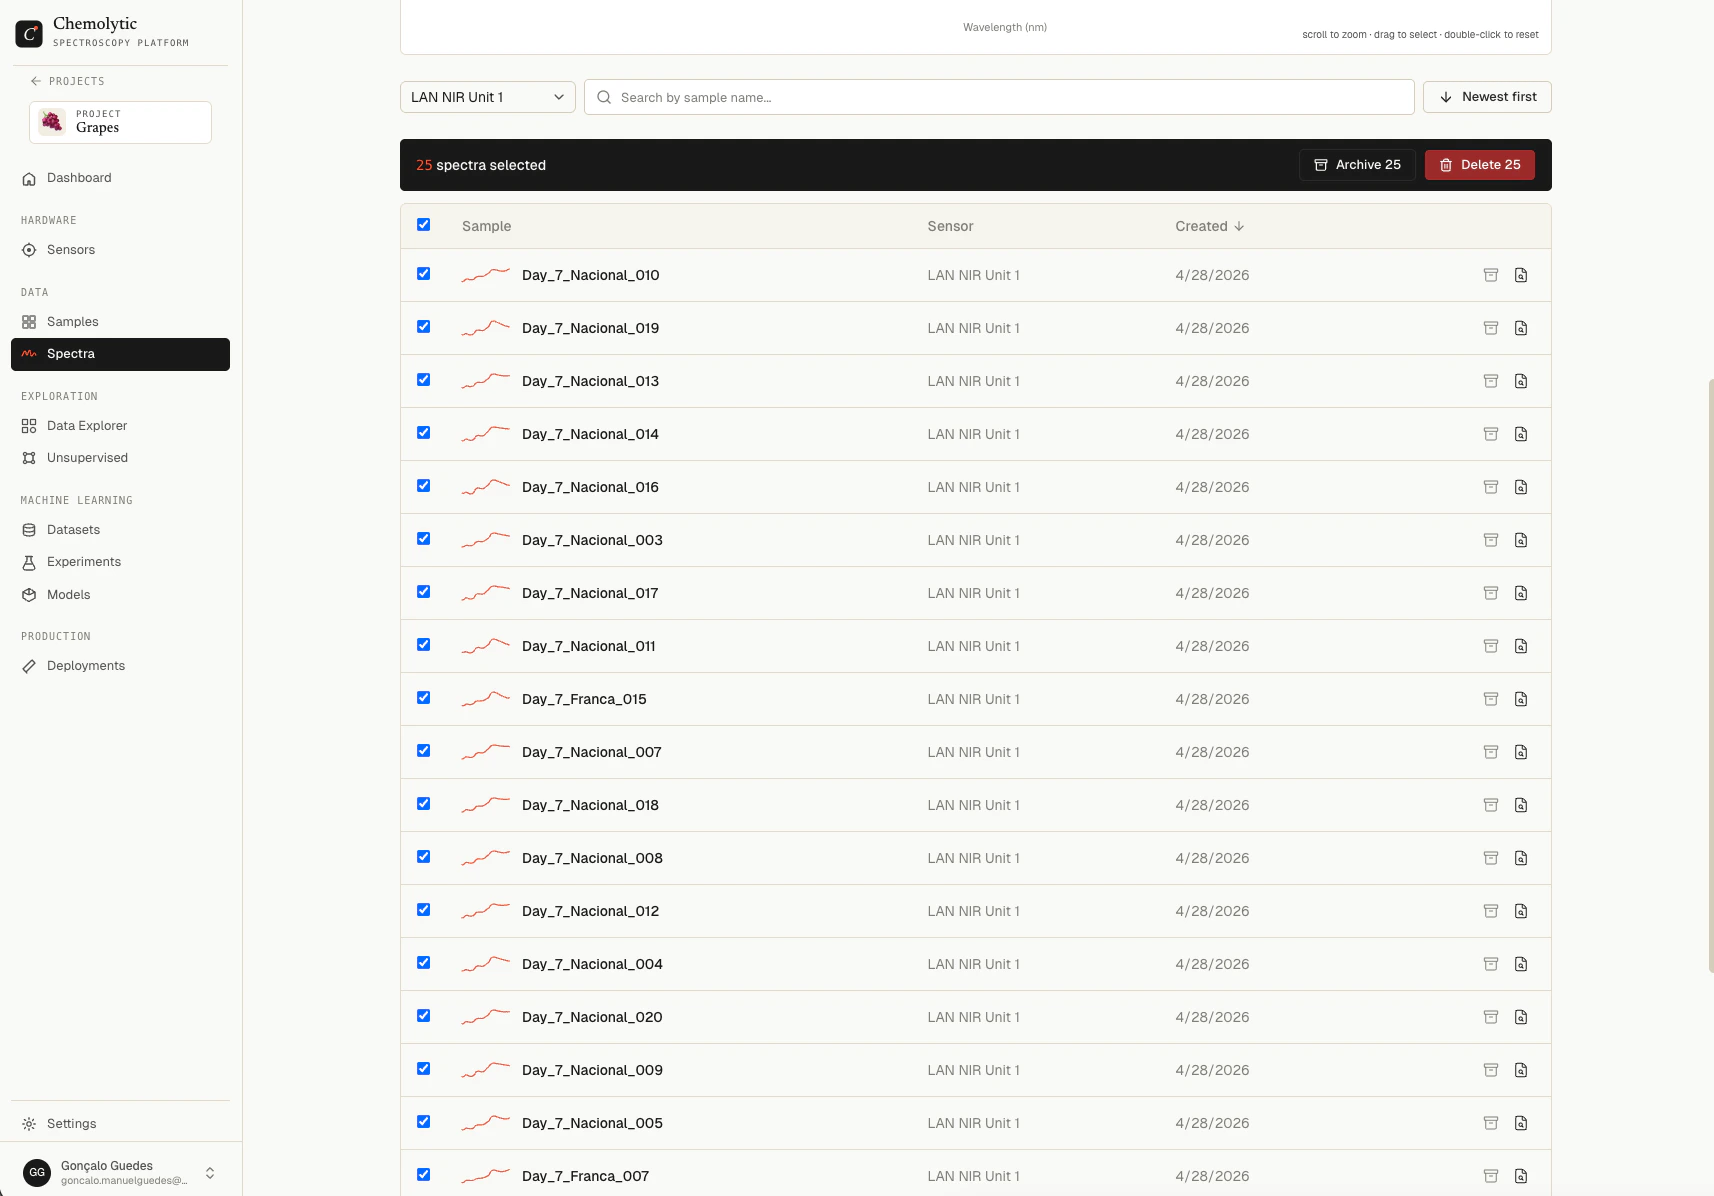
Select multiple spectra using the row checkboxes. A toolbar appears at the bottom of the page with the count and action buttons:
* **Archive N** (when on Active tab)
* **Unarchive N** (when on Archived tab)
* **Delete N** (when on Archived or All tab)
The detail panel shows:
* The interactive chart for this spectrum
* Sample name and linked sensor
* Sensor units (x and y)
* Metadata extracted from the original file (if any)
* Creation date and spectrum ID
## Archiving a spectrum
Archive is a **reversible** soft delete. Archived spectra:
* Are hidden from the Active tab
* Cannot be used in new datasets or analyses
* Still count toward your plan's spectra limit
* Can be unarchived at any time
To archive, open a spectrum and click **Archive**, or select multiple rows and click **Archive N** in the selection toolbar.
To unarchive, switch to the **Archived** tab, open a spectrum, and click **Unarchive**.
Use archive when you want to remove a spectrum from active modelling (because it's an outlier or measurement error) but might still need it later for reference.
## Deleting a spectrum
Delete is **permanent**. Deleted spectra cannot be recovered.
You can only delete spectra that have been **archived first**. The delete button is hidden on active spectra. Archive a spectrum before you can delete it.
From the Active tab, archive any spectra you want to delete.
Click the **Archived** tab.
Open the spectrum (or select multiple) and click **Delete**. A confirmation dialog appears with the warning "Irreversible action".
## Bulk operations
Select multiple spectra using the row checkboxes. A toolbar appears at the bottom of the page with the count and action buttons:
* **Archive N** (when on Active tab)
* **Unarchive N** (when on Archived tab)
* **Delete N** (when on Archived or All tab)
 ## Spectra and samples
Every spectrum is linked to exactly one sample. If the sample doesn't exist when you upload, Chemolytic creates it automatically using the name from the file or extracted from the filename. See [Uploading spectra](/data/uploading-spectra) for full details.
If you delete a sample, **all its spectra are deleted as well**. This cannot be undone.
## Spectra and sensors
Every spectrum is linked to exactly one sensor. The sensor's x-axis (point count and range) is locked when the first spectrum is uploaded. All subsequent spectra must match.
If you need a different x-axis for the same instrument (different resolution or range), create a new sensor.
## Spectra and samples
Every spectrum is linked to exactly one sample. If the sample doesn't exist when you upload, Chemolytic creates it automatically using the name from the file or extracted from the filename. See [Uploading spectra](/data/uploading-spectra) for full details.
If you delete a sample, **all its spectra are deleted as well**. This cannot be undone.
## Spectra and sensors
Every spectrum is linked to exactly one sensor. The sensor's x-axis (point count and range) is locked when the first spectrum is uploaded. All subsequent spectra must match.
If you need a different x-axis for the same instrument (different resolution or range), create a new sensor.